
Institution: Walsh's Speech Overpowers Treasury Department, Gold Faces Risk of Returning to $4,215

Huitong Net, September 2 — The World Gold Council stated on Tuesday that the U.S. Treasury wants to push down U.S. bond yields, while the Federal Reserve seeks lower inflation, but the Federal Reserve has more firepower. Walsh’s hawkish remarks last Friday pushed gold prices back below the 200-day moving average, and rising yields have increased gold’s opportunity cost. From a technical perspective, gold prices face the risk of falling to the 55-day moving average ($4,215), or entering a sideways range; initial resistance is seen at the 200-day moving average of $4,530, with key supports at $4,311 and $4,215.
The U.S. Treasury and the Federal Reserve are sending contradictory signals to the market. The World Gold Council (WGC) points out that recent events are overall a net negative for gold: gold prices are pulling back, and global bond yields are rising. In a report released on Tuesday (September 1), the Council provides investors with an overview of gold’s situation in the current "policy tug-of-war."
Contrasting Fiscal and Monetary Policy; The Fed Shows Greater Firepower
The U.S. Treasury seems to want lower yields, while the Federal Reserve wants lower inflation. Neither wants to break the economy, though breaking the economy might be the blunt way to achieve both goals simultaneously.
WGC analysts wrote on Tuesday, "Of the two, the Federal Reserve has more firepower. So, when Chair Walsh set a hawkish tone last Friday, the market got a shock. Two-year yields swung sharply, reflecting repricing for tighter expectations, and gold prices fell below the 200-day moving average."
Analysts noted that persistently hot U.S. inflation data, together with Walsh’s hawkish speech at the Jackson Hole symposium, increased market bets on the Fed hiking rates soon. This pushed up gold’s perceived opportunity cost and dampened its appeal. Analysts wrote: "Meanwhile, global gold ETF inflows continue, albeit at a slower pace; futures net longs are rising, while overall call option positioning has edged slightly lower."
Technical Alert: After Hitting Resistance at the 50% Retracement, the Market May Be Forming a Sideways Range
Turning to the technical picture, WGC analysts stated that with short-term momentum weakening and global bond yields continuing to climb, gold prices face the risk of sliding toward the 55-day moving average.
Analysts wrote: "Gold’s strength once extended to near both the 50% retracement of the 2026 bear market and the resistance at the May highs of $4,769 to $4,774 per ounce. The subsequent sharp pullback has brought the market below the 200-day moving average, entering a possible emerging sideways range."
Analysts added: "With the daily RSI momentum topping out and net long positions surging, we see room for a deeper pullback within this range, especially considering the rise in global bond yields."
Key Levels: Support at $4,215, Resistance at $4,530
Analysts said: "Initial support is at the mid-August low of $4,311 per ounce, while more importantly, the rising 55-day moving average is now at $4,215 per ounce. Our inclination is to look for another bottom in this area. Initial resistance is at the 13-day EMA, currently $4,474 per ounce, followed by the 200-day moving average at $4,530 per ounce. A move back above this level would be seen as a return to a short-term bullish trend, with resistance shifting to the recent high of $4,696 per ounce and the $4,769–$4,774 area."
Conclusion
Wedged between the Treasury’s desire to press yields lower and the Fed’s effort to suppress inflation, gold is struggling to find direction. In the short term, Walsh’s hawkish stance and rising global bond yields have put gold prices under the 200-day moving average; yet the World Gold Council also points out that supports at $4,311 and even $4,215 continue to provide a safety buffer for this correction. For gold, whether the current sideways range is a period of accumulation or a sign of topping out may ultimately depend on how far the current surge in global bond yields can run.
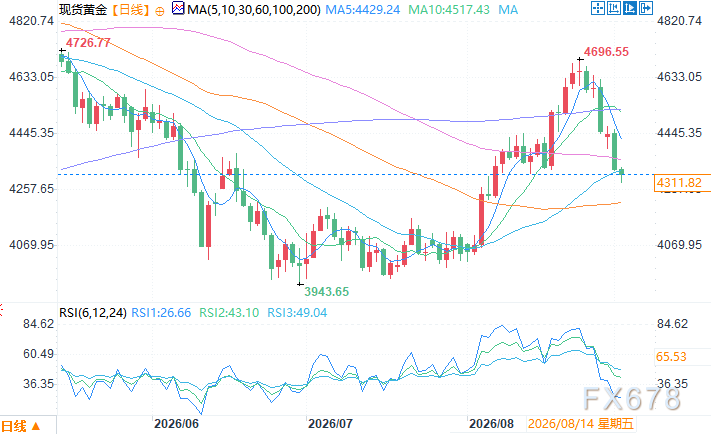
Spot Gold Daily Chart. Source: Easy Huitong
Beijing Time, September 2, 13:31 Spot Gold quoted at $4,322.82/oz
Disclaimer: The content of this article solely reflects the author's opinion and does not represent the platform in any capacity. This article is not intended to serve as a reference for making investment decisions.
You may also like
Bitcoin and Gold Are Both Seeing Billions Flow In What Are Traders Preparing For?
Solana analyst sets $150 target as network hits new transaction record
$150 Billion Revenue Becomes AI Business Watershed! Morgan Stanley Maintains "Overweight" Rating on Broadcom (AVGO.US), Warns that Success Depends Entirely on Expectation Gap
Broadcom (AVGO.US) will release its fiscal year 2026 third quarter financial report after the US stock market closes on September 2 (early morning on September 3, Beijing time).


