Gold sellers trade on a weekly basis, while gold buyers take positions with a decades-long horizon.
Forex Net, September 3—— The logic of the bears will be tested at the following two points in time: Nonfarm payroll data for August will be released on Friday, September 4; the Federal Reserve will hold a rate-setting meeting on Wednesday, September 16. This week, the market's position structure changed, but the long-term bullish case for gold remains intact.
On Thursday (September 3), spot gold rebounded for the second consecutive day, with intraday gains approaching 1%. Previously, gold prices had fallen more than 2% on Tuesday. The logic behind these two rounds of declines is not complicated: market expectations shifted from anticipating the Federal Reserve to hold rates unchanged, to expecting a rate hike. Gold does not generate interest itself, so when the opportunity cost of holding gold rises, gold prices come under downward pressure. By Thursday, gold prices had climbed back near $4,425.
The more interesting question is: while official institutions around the world are continuously accumulating gold, who is selling?
Why did the Dutch central bank transfer 86 tonnes of gold to London?
The Dutch Central Bank (DNB) transferred 86 tonnes of gold out of vaults in New York and Ottawa, with the shipments completed in stages between March and August. This volume accounts for more than a quarter of the total gold reserves the DNB holds in North American vaults (about 313 tonnes).
DNB's gold holdings in New York decreased from 31.3% to 18.5%, Ottawa's share dropped from 19.7% to 18.5%, while London vaults increased from 18.1% to 32.1%. DNB President Klaas Knot stated that this move was driven by considerations of gold liquidity and was not a bet on price movement. He noted that after the adjustment, the central bank would be able to mobilize these reserves more quickly.
It is worth noting that both the method of operation and the amount transferred are equally important. The DNB physically shipped about 27 tonnes of gold; the remainder was transferred via book transactions with no need for melting and recasting gold bars.
If central banks around the world keep buying gold, who are the sellers?
Deutsche Bank’s conclusion: the main sellers are commercial entities and ordinary individual holders, not the trend-following funds the public typically assumes.
The bank’s Head of Precious Metals Research, Daniel Briesemann, wrote on Tuesday (September 1) that selling pressure in the spot market has largely been exhausted; Commodity Trading Advisors (CTAs) are actually buyers absorbing the sell orders, not the driving force behind the recent decline. He gave a clear critical level: only if gold prices fall below about $4,315 per ounce will a new round of systematic selling be triggered; as long as the price holds above this level, ordinary weakening will not cause a cascading decline.
Meanwhile, discretionary macro funds did not participate in the late summer rally in gold prices. This means such capital could become the next wave of buyers, rather than sellers. In terms of price levels, Tuesday's closing low and Wednesday's intraday low were both within 0.5% of the $4,315 line.
Not at all; there was a typical case of contrast on Wednesday. Just hours after the Deutsche Bank research report spread, TD Securities gave a completely opposite short-term assessment based on the same set of data.
Ryan McKay and Bart Melek believe gold is close to the CTA programmatic selling threshold — about $4,300. Their model suggests gold could fall toward the $4,200–$4,100 range, where all systematic positions would be liquidated.
They also note that the market is already pricing in more than two Fed rate hikes by 2027.
However, both institutions reach the same long-term conclusion: neither sees significant long-term downside for gold, as currency devaluation logic is playing out again, and there remains great uncertainty about Fed rate hikes themselves. Incidentally, Briesemann previously worked in TD Securities' precious metals trading division, and was only poached by Deutsche Bank in May this year. With the same background and the same data, the two analyst teams reached sharply different judgments.
This week, the market has already priced in this possibility with two swings. ADP data on Wednesday showed that U.S. private sector payrolls rose by just 38,000 in August, below the Dow Jones consensus of 47,000 and the smallest gain since January this year; manufacturing payrolls alone fell by 17,000 (ADP). After the data was released, gold prices reversed from a decline to a gain during the session.
In addition, U.S. Treasury Secretary Scott Nathan met with Bank of Japan Governor Kazuo Ueda. The U.S. Treasury stated that the Secretary urged the Japanese side to take "decisive action" to curb yen weakness.
The essence of the matter: The U.S. Treasury is openly pressuring foreign central banks to tighten monetary policy, boosting their own currencies to counteract dollar strength.
Background: The Bank of Japan is scheduled to hold its rate meeting on September 17–18, just two days after the Fed meeting. The market has almost fully priced in that Japan will begin rate hikes. The yield on Japan’s 10-year government bonds has already touched 3%, the highest since 1996.
Because the two classes of funds were trading in completely opposite directions, and the longer-term side dominated the August market. Gold closed August up 9.6%, its strongest monthly performance since January; silver gained about 15% in the same period.
Meanwhile, Fed Watch Tool data from CME showed that the probability of a September rate hike jumped from about 36% to 64% due to Fed Chair Powell’s speech at the Jackson Hole Symposium.
The turning point in real interest rates explains the price action: the 10-year TIPs yield bottomed at 2.32% on Tuesday, August 25, then climbed to 2.44% on August 31 (Fed Economic Database). Gold prices peaked in that week and have since given back some gains.
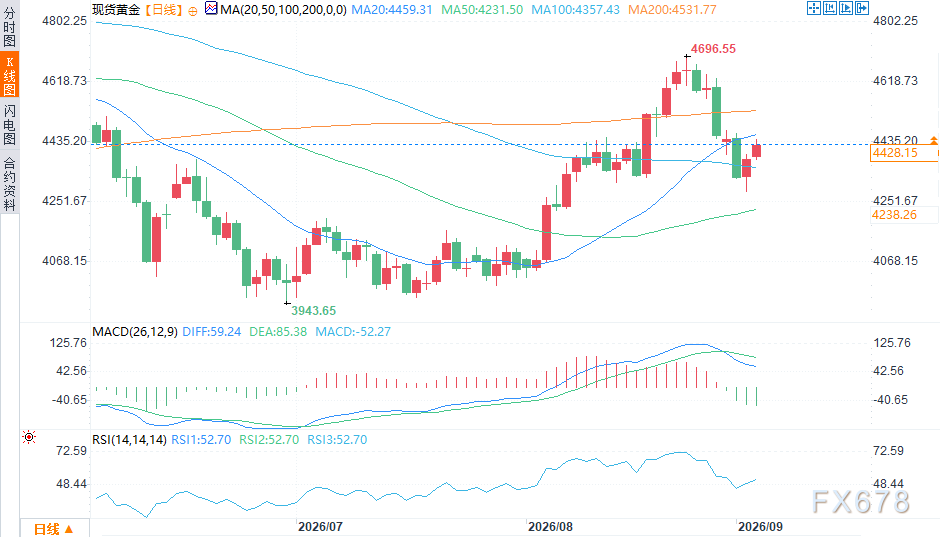
(Spot gold daily chart Source: Eurex Forex Net)
Italy’s UniCredit Bank on Wednesday continued to raise its forecast range for gold at the end of 2026 to $4,400–$5,200. The bullish view is supported by three pillars: continued central bank buying, a continued steepening yield curve for U.S. Treasuries, and the return of gold ETF flows.
The concerns of the two groups of participants are completely different: Trend-following funds care about where gold prices will go in the next three weeks; when real yields are at 2.44%, selling is a rational decision.
Reserve managers are concerned with a different question: If the current monetary system fails, will gold as a store of wealth still hold value? Interest rates cannot answer that question.
The Dutch central bank’s transfer of 86 tonnes of gold is not about predicting the outcome of the September Fed meeting; it is about being able to quickly deploy these reserves if an unforeseen crisis occurs.
World Gold Council data shows central bank gold purchases hit a record in the second quarter, reaching 288.9 tonnes.
The two upcoming time points will test the bears’ logic: Nonfarm payroll data for August is released on Friday, September 4; the Federal Reserve holds its rate meeting on Wednesday, September 16. This week, the market’s position structure changed, but the long-term bullish logic for gold remains unbroken.





