The Biggest Zcash Strength Is Now a Weakness as Buying Collapses 97% —Breakdown Next?

Zcash price has turned sharply lower even as the wider market rises more than 6% today. Bitcoin, Ethereum, and most large caps have bounced, but ZEC remains one of the biggest laggards, falling more than 4% in the last 24 hours and over 40% in the past week. This contrast raises a clear question: why
Zcash price has turned sharply lower even as the wider market rises more than 6% today. Bitcoin, Ethereum, and most large caps have bounced, but ZEC remains one of the biggest laggards, falling more than 4% in the last 24 hours and over 40% in the past week. This contrast raises a clear question: why is Zcash weakening when the rest of the market is recovering?
The answer begins with the same factor that helped Zcash outperform for months.
Zcash’s Biggest Strength Is Now Becoming Its Weakness
For most of the year, Zcash carried a negative correlation with Bitcoin. The one-year Pearson correlation coefficient, which measures how two assets move together or apart, sits near –0.06 for ZEC.
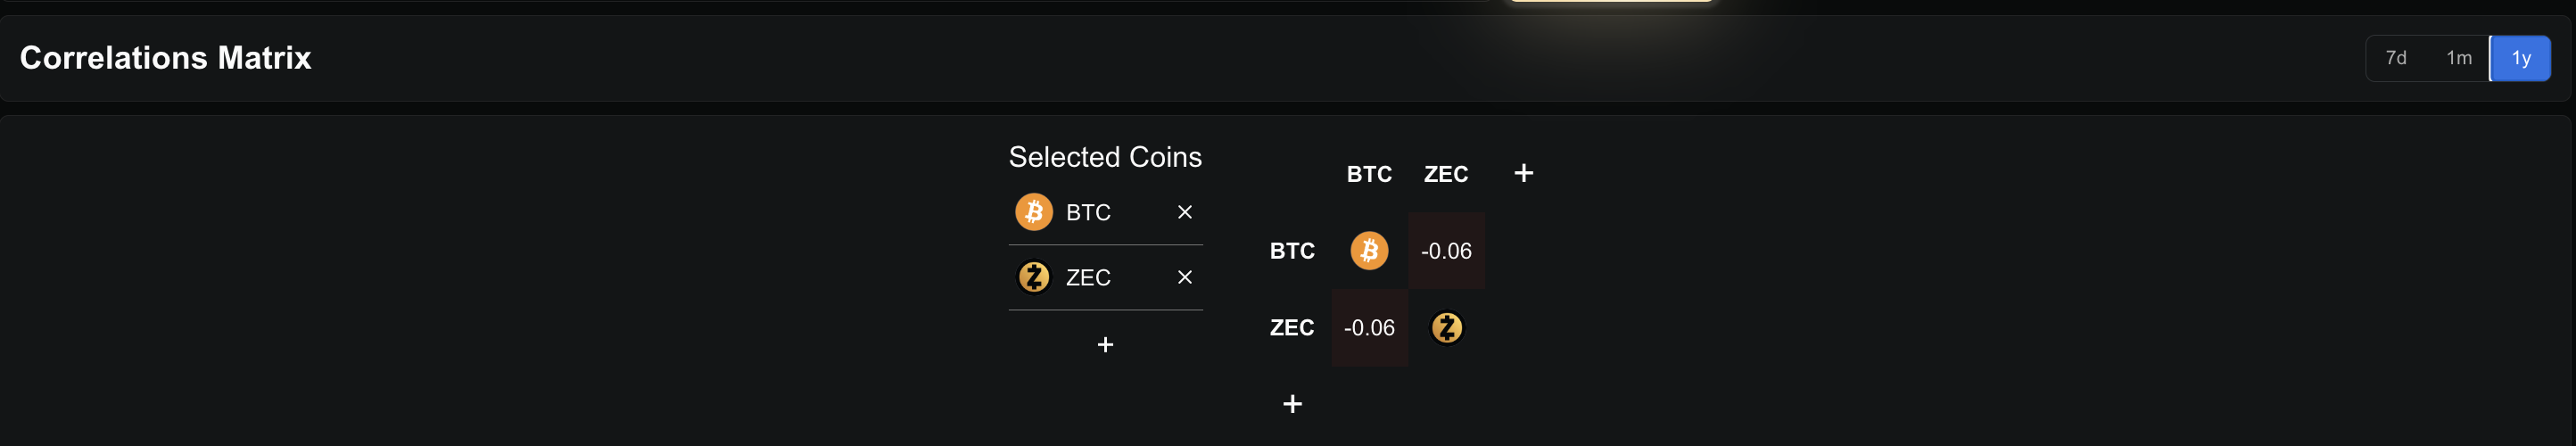 ZEC-BTC Correlation:
Want more token insights like this? Sign up for Editor Harsh Notariya’s Daily Crypto Newsletter
A negative value means ZEC often moves in the opposite direction of BTC. This was its biggest strength during late October and November, when Bitcoin struggled while ZEC surged more than 650% in the 3-month horizon.
Now that Bitcoin is rising, this same negative link is working against Zcash.
And the chart confirms the pressure.
The 20-day exponential moving average (EMA), which tracks short-term momentum by giving more weight to recent prices, is closing in on the 50-day EMA. If the 20-day crosses below the 50-day, it would confirm a loss of strength and could extend the Zcash decline beyond the current 40% weekly slide.
 Looming EMA Cross:
The trend that once protected ZEC during Bitcoin weakness has now flipped into a structural disadvantage.
Buying Pressure Collapses 97%, But Selling Pressure Begins to Ease
The biggest red flag appeared between December 1 and December 2. Exchange outflows — a proxy for buying demand — fell from $61.06 million to just $1.74 million.
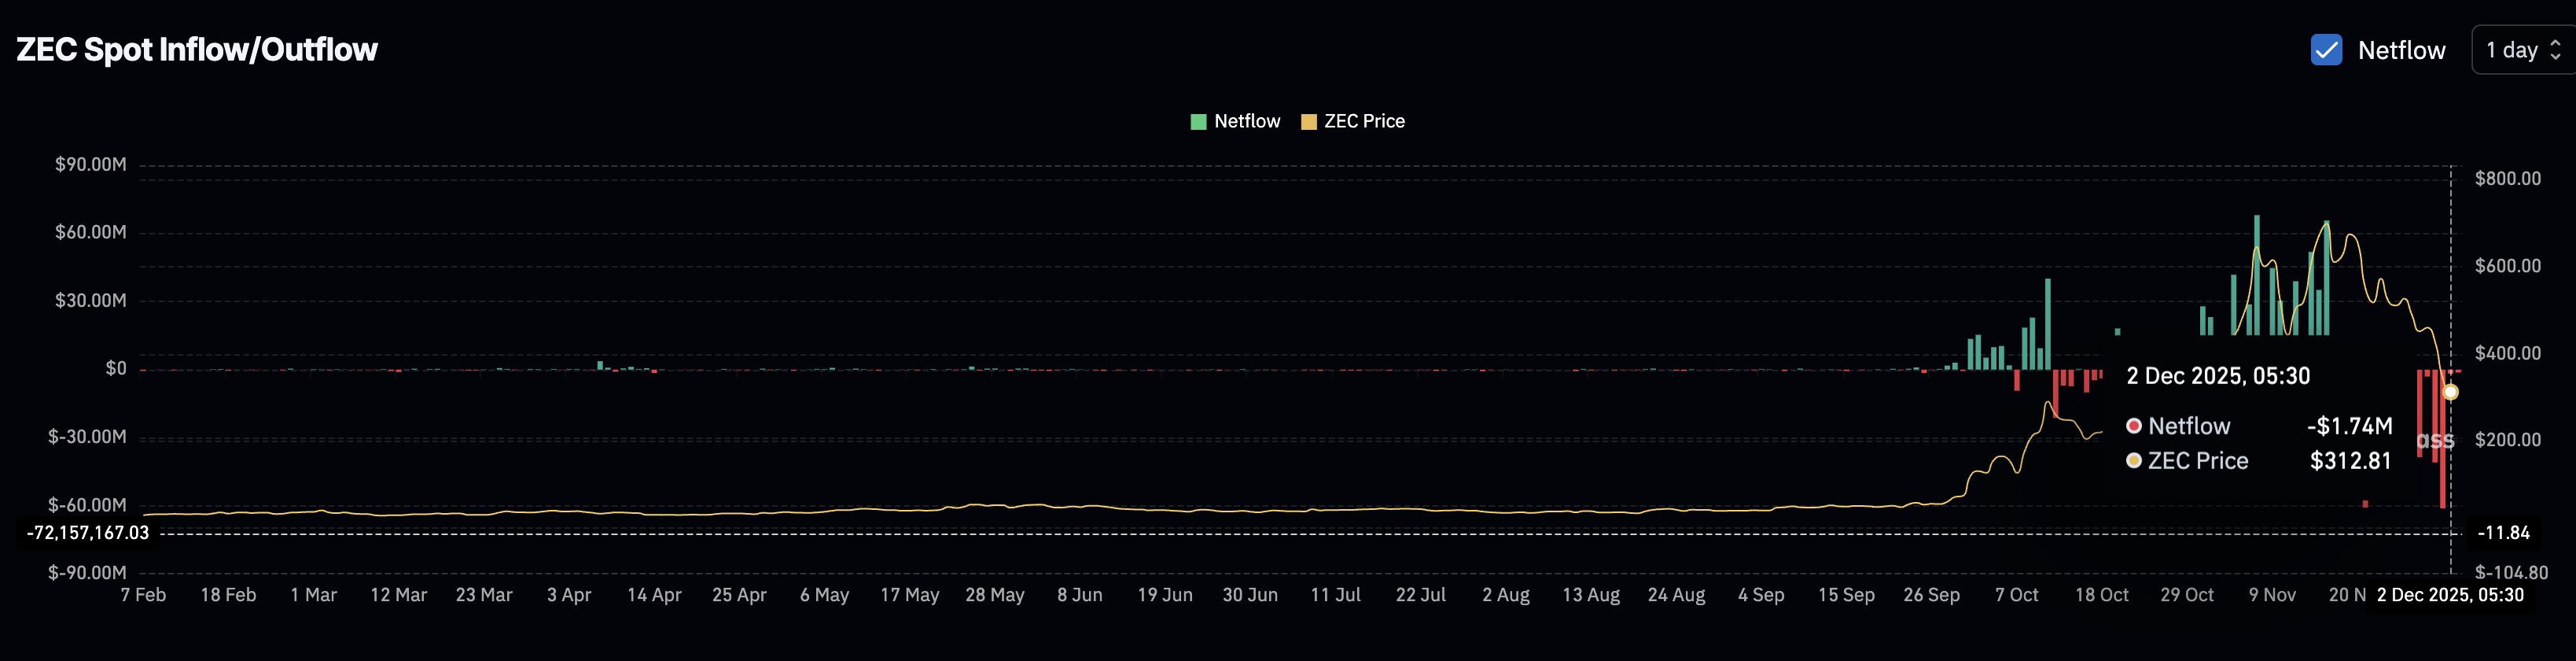 Dip In Buying Pressure:
When comparing the scale of outflows, this reflects roughly a 97% collapse in buying pressure within a single day. This drop signals that traders who had been accumulating aggressively through the October–November rally have suddenly stepped back.
But one element still keeps the chart from turning fully bearish.
Wyckoff volume colors show that selling pressure has begun to soften in the last two sessions. Yellow bars, which indicate sellers gaining control, have gradually weakened.
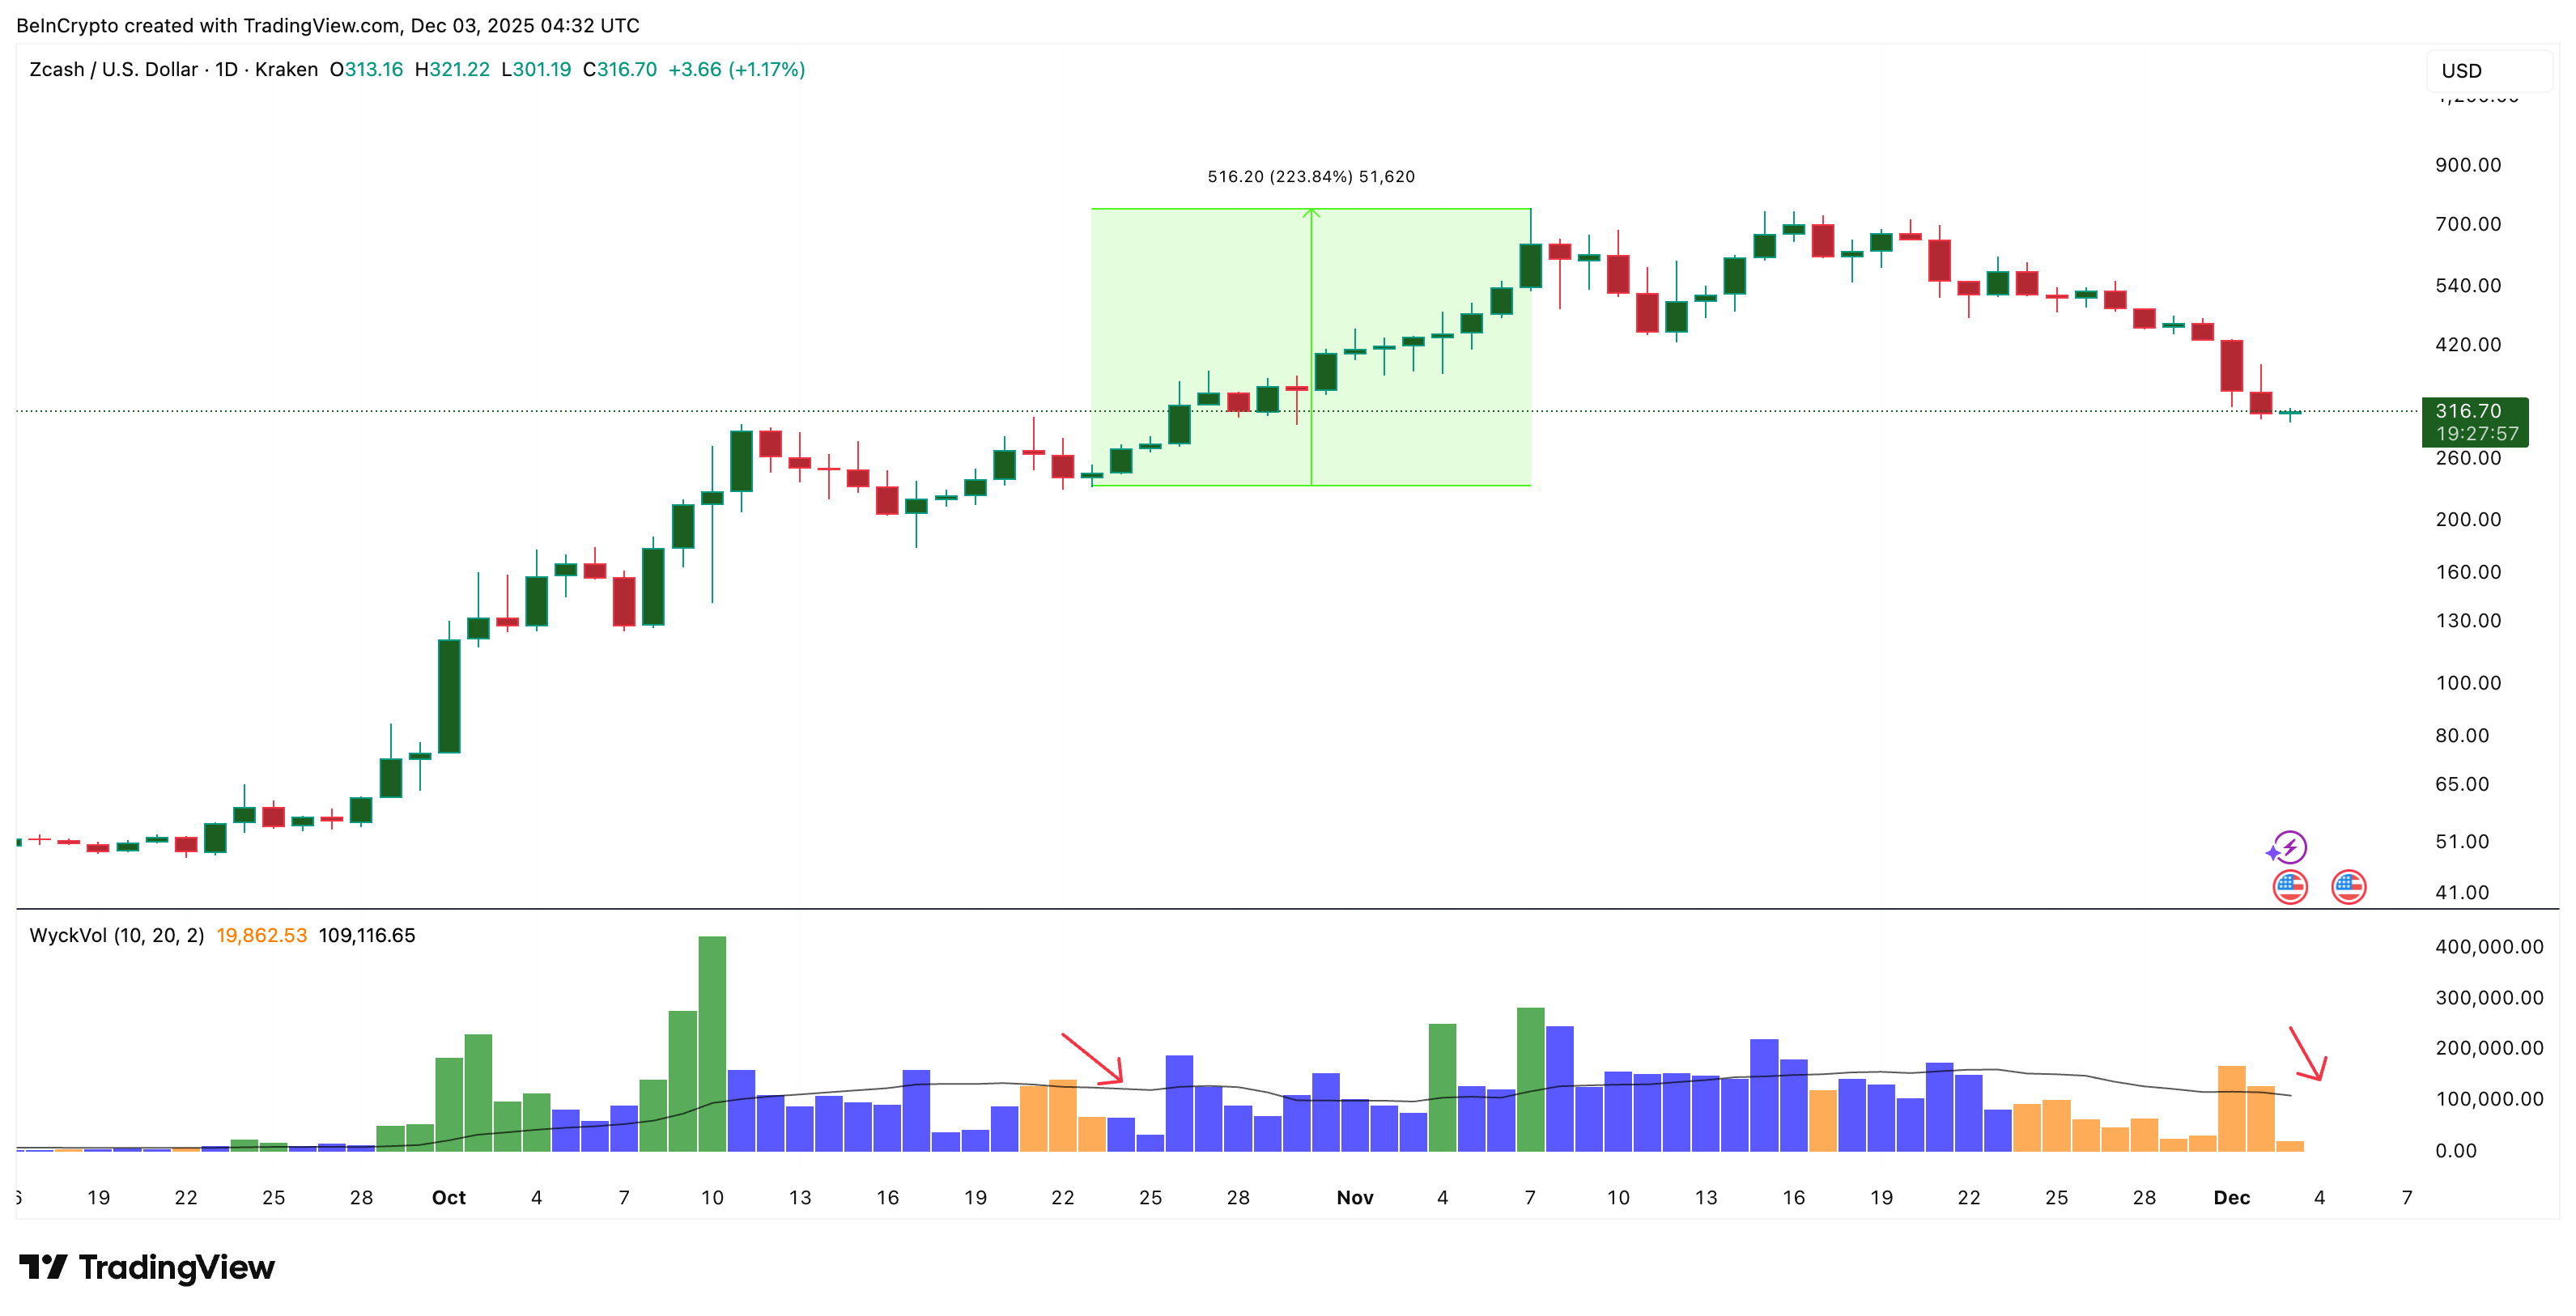 Zcash Sellers Might Be Losing Strength:
A similar pattern appeared between October 23 and 25. Soon after, buyers regained control with blue bars surfacing, and ZEC rallied more than 230%. So while buying pressure has collapsed, selling pressure is also reducing since yesterday, leaving the Zcash price at a conflicted but important turning point.
On the flipside, weakening buying and selling activity can eventually lead to a range-bound ZEC price movement.
Key Zcash Price Levels to Watch: Breakdown or Stabilization?
ZEC’s ability to avoid a deeper breakdown depends on holding a few major levels.
The first support sits near $299. Losing this zone would expose the next region around $210, where previous reactions formed a temporary base. A further slip could drag Zcash toward $124, a level seen during early-cycle resets.
For any recovery to develop, ZEC must reclaim $426, which would be a 34% bounce from current levels and mark the start of a reversal attempt. If buyers sustain momentum above that zone, the next major ceiling remains $736, a barrier ZEC has failed to break since early November.
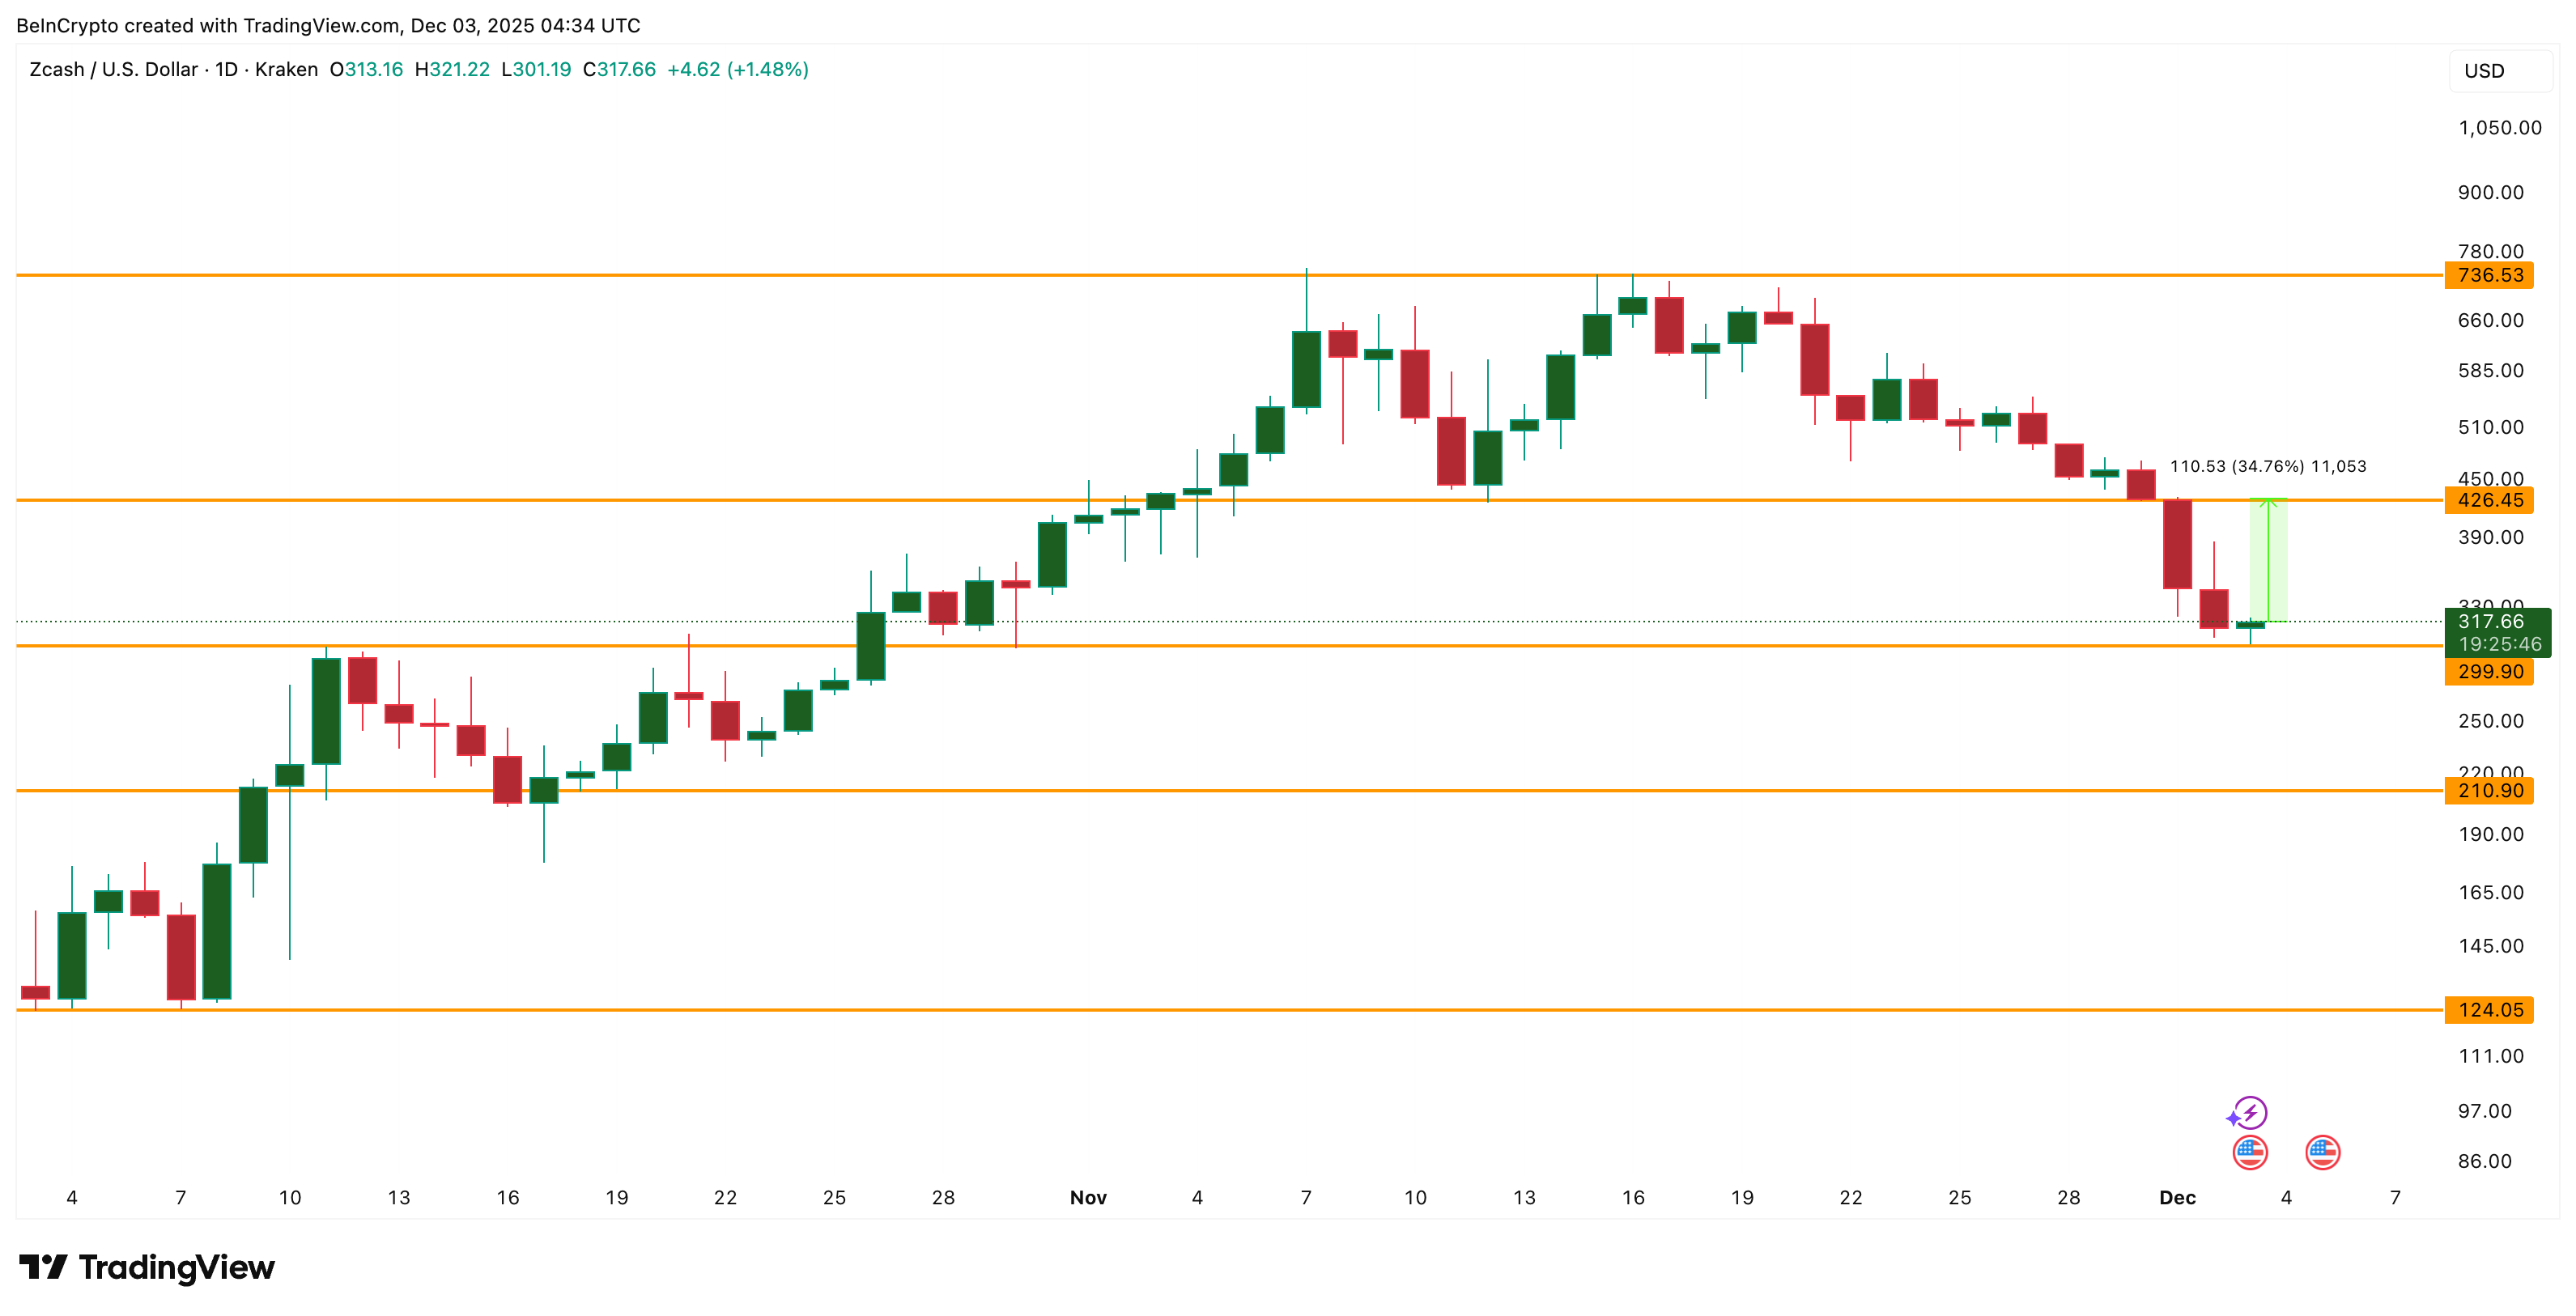 Zcash Price Analysis:
Right now, Zcash price sits at a crossroads: its biggest historical strength — moving opposite to Bitcoin — has turned into a weight on its price, buying pressure has collapsed by 97%, and the bearish EMA setup is nearing. Only easing sell pressure and a reclaim of $426 keep the path to stabilization open.
Disclaimer: The content of this article solely reflects the author's opinion and does not represent the platform in any capacity. This article is not intended to serve as a reference for making investment decisions.
You may also like
TWT's Tokenomics Revamp for 2025: Supply Structure Adjustment and Lasting Value Impact
Aster DEX: Connecting Traditional Finance and DeFi by Streamlining Onboarding and Encouraging Institutional Participation
- Aster DEX bridges TradFi and DeFi via a hybrid AMM-CEX model, multi-chain interoperability, and institutional-grade features. - By Q3 2025, it achieved $137B in perpetual trading volume and $1.399B TVL, driven by yield-bearing collateral and confidential trading tools. - Institutional adoption surged through compliance with MiCAR/CLARITY Act, decentralized dark pools, and partnerships with APX Finance and CZ. - Upcoming Aster Chain (Q1 2026) and fiat on-ramps aim to enhance privacy and accessibility, pos

Fade the Fear: Astronomer Says BTC Next Leg to $112K–$160K Starts Now
Astar (ASTR) Value Soars as Ecosystem Broadens and User Adoption Accelerates
- Astar (ASTR) gains momentum through strategic partnerships with Sony , Toyota , and enterprise-grade blockchain solutions. - Tokenomics 3.0 and Burndrop program reduce supply inflation, boosting institutional confidence via $3. 3M OTC trades and buybacks. - Astar zkEVM and Plaza integration enhance cross-chain scalability, driving 20% Q3 2025 wallet growth and $2.38M TVL. - Governance transition to community councils by 2026 and projected $0.0167–$0.0333 price targets highlight long-term investment appea