Tether Dominance Hits 6% in November – Why This Is a Worrying Signal

In November 2025, the Tether Dominance index (USDT.D) — the share of USDT’s market cap relative to the total crypto market cap — officially surpassed 6%. It also broke above a descending trendline that had remained intact since 2022. Analysts have expressed concern as USDT.D breaks a long-term resistance level. The move often signals the
In November 2025, the Tether Dominance index (USDT.D) — the share of USDT’s market cap relative to the total crypto market cap — officially surpassed 6%. It also broke above a descending trendline that had remained intact since 2022.
Analysts have expressed concern as USDT.D breaks a long-term resistance level. The move often signals the beginning of a major correction or even an extended bear market for the entire crypto market.
How Significant Is the Rise of USDT.D in the Market Context of November?
TradingView data shows that USDT.D reached 6.1% on November 18 before pulling back to 5.9%.
Earlier in the month, this metric sat below 5%. The increase reflects heightened caution among investors. Many have rotated capital into the most liquid stablecoin instead of deploying funds to buy deeply discounted altcoins.
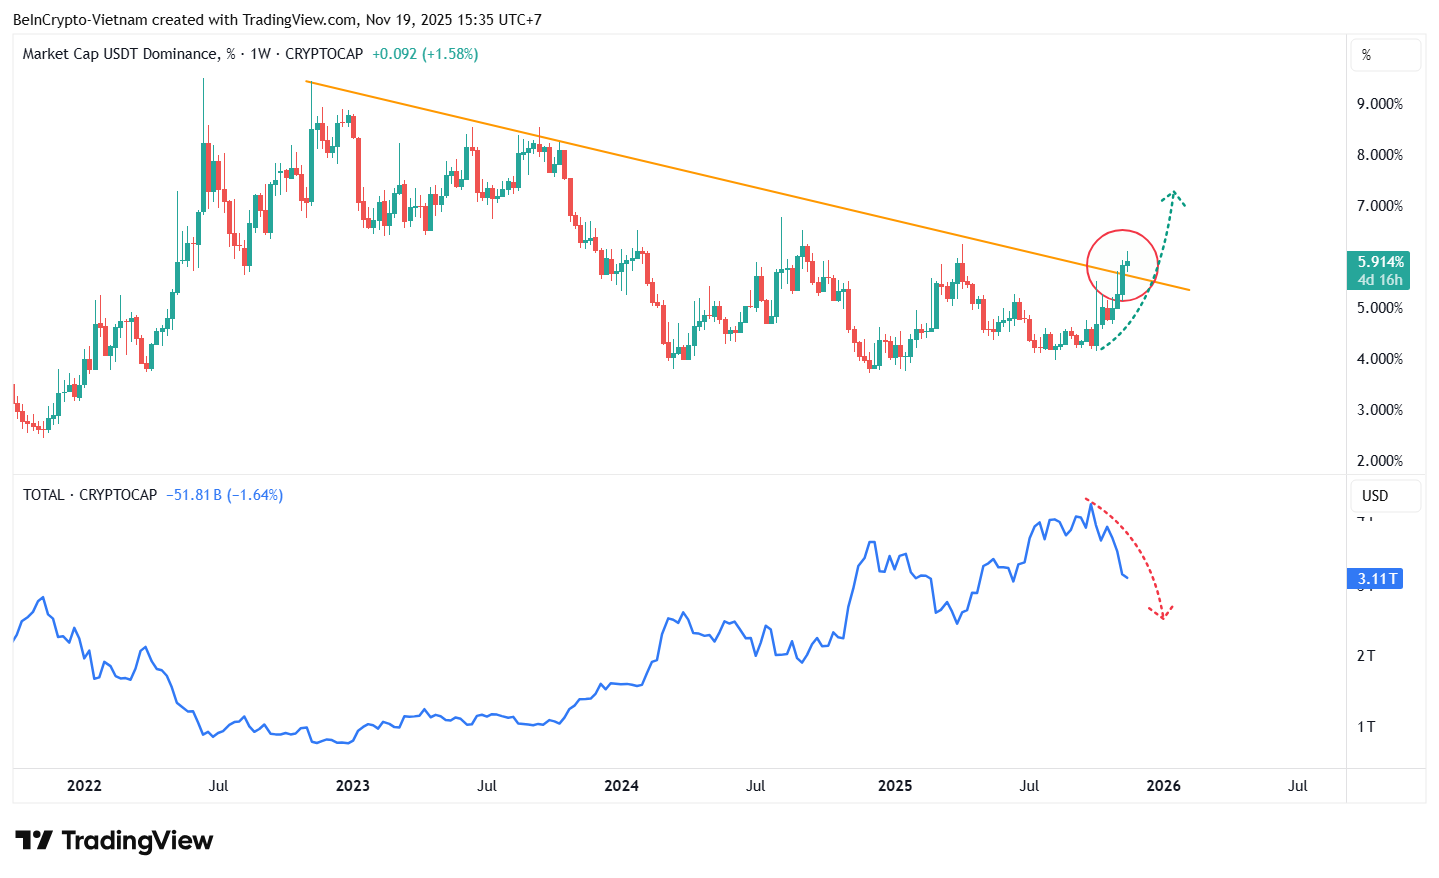 USDT.D vs. Total Market Cap. Source:
TradingView
USDT.D vs. Total Market Cap. Source:
TradingView
Historical data indicate a strong inverse correlation between USDT.D and total market capitalization. Therefore, USDT.D breaking above a trendline that has held for nearly four years may signal deeper market-wide declines ahead.
Several analysts expect USDT.D to climb toward 8% by the end of the year, implicitly suggesting that a bear market may be forming in November. This projection has merit because fear continues to grow and shows no signs of easing.
In addition, the well-known analyst Milk Road highlights a notable shift in the stablecoin market. DefiLlama data shows that the total stablecoin market cap fell from $309 billion at the end of October to $303.5 billion in November.
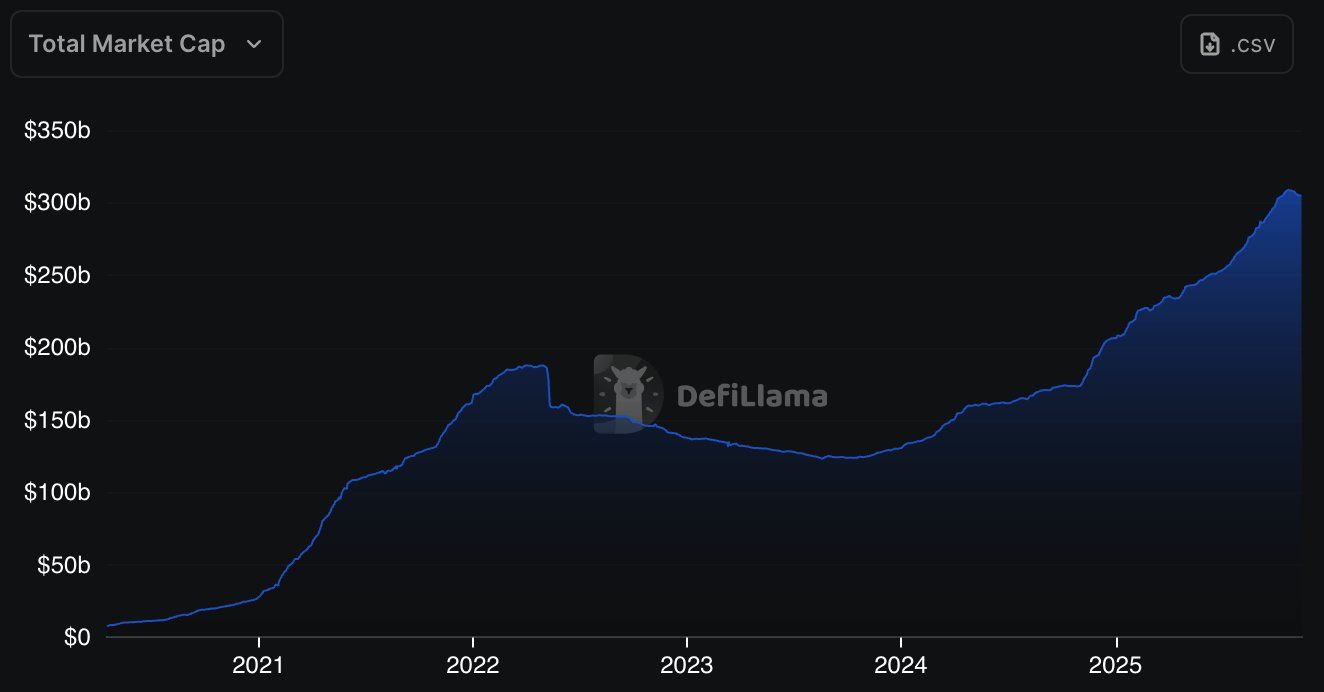 Stablecoin Market Cap. Source:
DefiLlama
Stablecoin Market Cap. Source:
DefiLlama
The stablecoin market has shed approximately $5.5 billion in less than a month. This marks the first significant decline since the 2022 bear market. The DefiLlama chart reveals that, after four years of continuous growth, the curve has flattened and is starting to turn downward.
The combination of a shrinking stablecoin market cap and a rising USDT.D suggests a broader trend. Investors appear not only to be selling altcoins into stablecoins but also withdrawing stablecoins from the market entirely.
“Expanding supply means fresh liquidity entering the system. When it flattens or reverses, it signals that the inflows powering the rally have cooled,” Milk Road said.
However, Milk Road still sees a glimmer of optimism in the current landscape. He argues that the situation does not necessarily indicate a crisis. Instead, the market is operating with less “fuel” for the first time in years, and such shifts often precede price changes.
Furthermore, a recent BeInCrypto report notes a contrasting trend. Despite the declining market cap, the amount of stablecoins held on exchanges has increased in November. This suggests that some investors view the downturn as an opportunity to position themselves for the end of the year.
Disclaimer: The content of this article solely reflects the author's opinion and does not represent the platform in any capacity. This article is not intended to serve as a reference for making investment decisions.
You may also like
The Psychological Factors Influencing Retail Investors’ Actions in Cryptocurrency Markets
- Crypto markets are shaped by behavioral finance, where retail investors drive volatility through FOMO, herd behavior, and overconfidence. - The PENGU token exemplifies this dynamic, surging 480% in July 2025 but plummeting 28.5% by October due to emotional trading cycles. - Social media amplifies emotional contagion, with traders checking prices 14.5 times daily, while financial literacy mitigates bias susceptibility. - Personality traits like neuroticism increase cognitive biases, and speculative narrat

Bitcoin News Today: Bitcoin's Unstable Holiday Periods Hide Average Gains of 6%
- Bitcoin's Thanksgiving-to-Christmas performance shows equal odds of rising or falling, with a 6% average seasonal return despite volatility. - Historical extremes include a 50% 2020 rally and 2022's 3.62% drop post-FTX collapse, amid a $2.49-to-$91,600 long-term surge since 2011. - 2025's $91,600 price reflects ongoing recovery from 2024's $95,531 peak, with institutional crypto adoption and macroeconomic factors shaping future trajectories. - Analysts advise dollar-cost averaging for retail investors, w
Australia Strikes a Balance Between Fostering Crypto Innovation and Safeguarding Investors with Updated Regulations
- Australia introduces 2025 Digital Assets Framework Bill to regulate crypto platforms under ASIC, creating "digital asset platform" and "tokenized custody platform" licenses. - The framework mandates custody standards, transparency requirements, and lighter regulations for small operators (<$5k per customer) to balance innovation with investor protection. - Global alignment with UAE and EU crypto regulations is emphasized, while addressing risks from past failures like FTX through stricter enforcement and

PENGU Token's Latest Price Fluctuations and Blockchain Indicators: An Analytical Perspective on Technical Factors and Institutional Activity
- PENGU token's recent volatility and on-chain activity spark debate over institutional involvement in the crypto market. - Technical indicators show conflicting signals: overbought RSI vs. positive MACD/OBV momentum since November 2025. - Whale accumulation and Solana integration suggest strategic buying, while team wallet outflows highlight market uncertainty. - Social media sentiment drives short-term price swings, but structural risks like tokenomics and regulatory ambiguity persist. - Institutional ad