Pi Coin Price Still In Green, Yet The Chart Now Shows 3 Red Flags — Pullback Soon?

Pi Coin price is still green on the monthly chart, but the short-term structure has shifted. A bearish engulfing pattern, weakening OBV, and a hidden bearish divergence now hint that the recent bounce may be losing strength. Unless PI reclaims key resistance soon, a deeper pullback zone could open up.
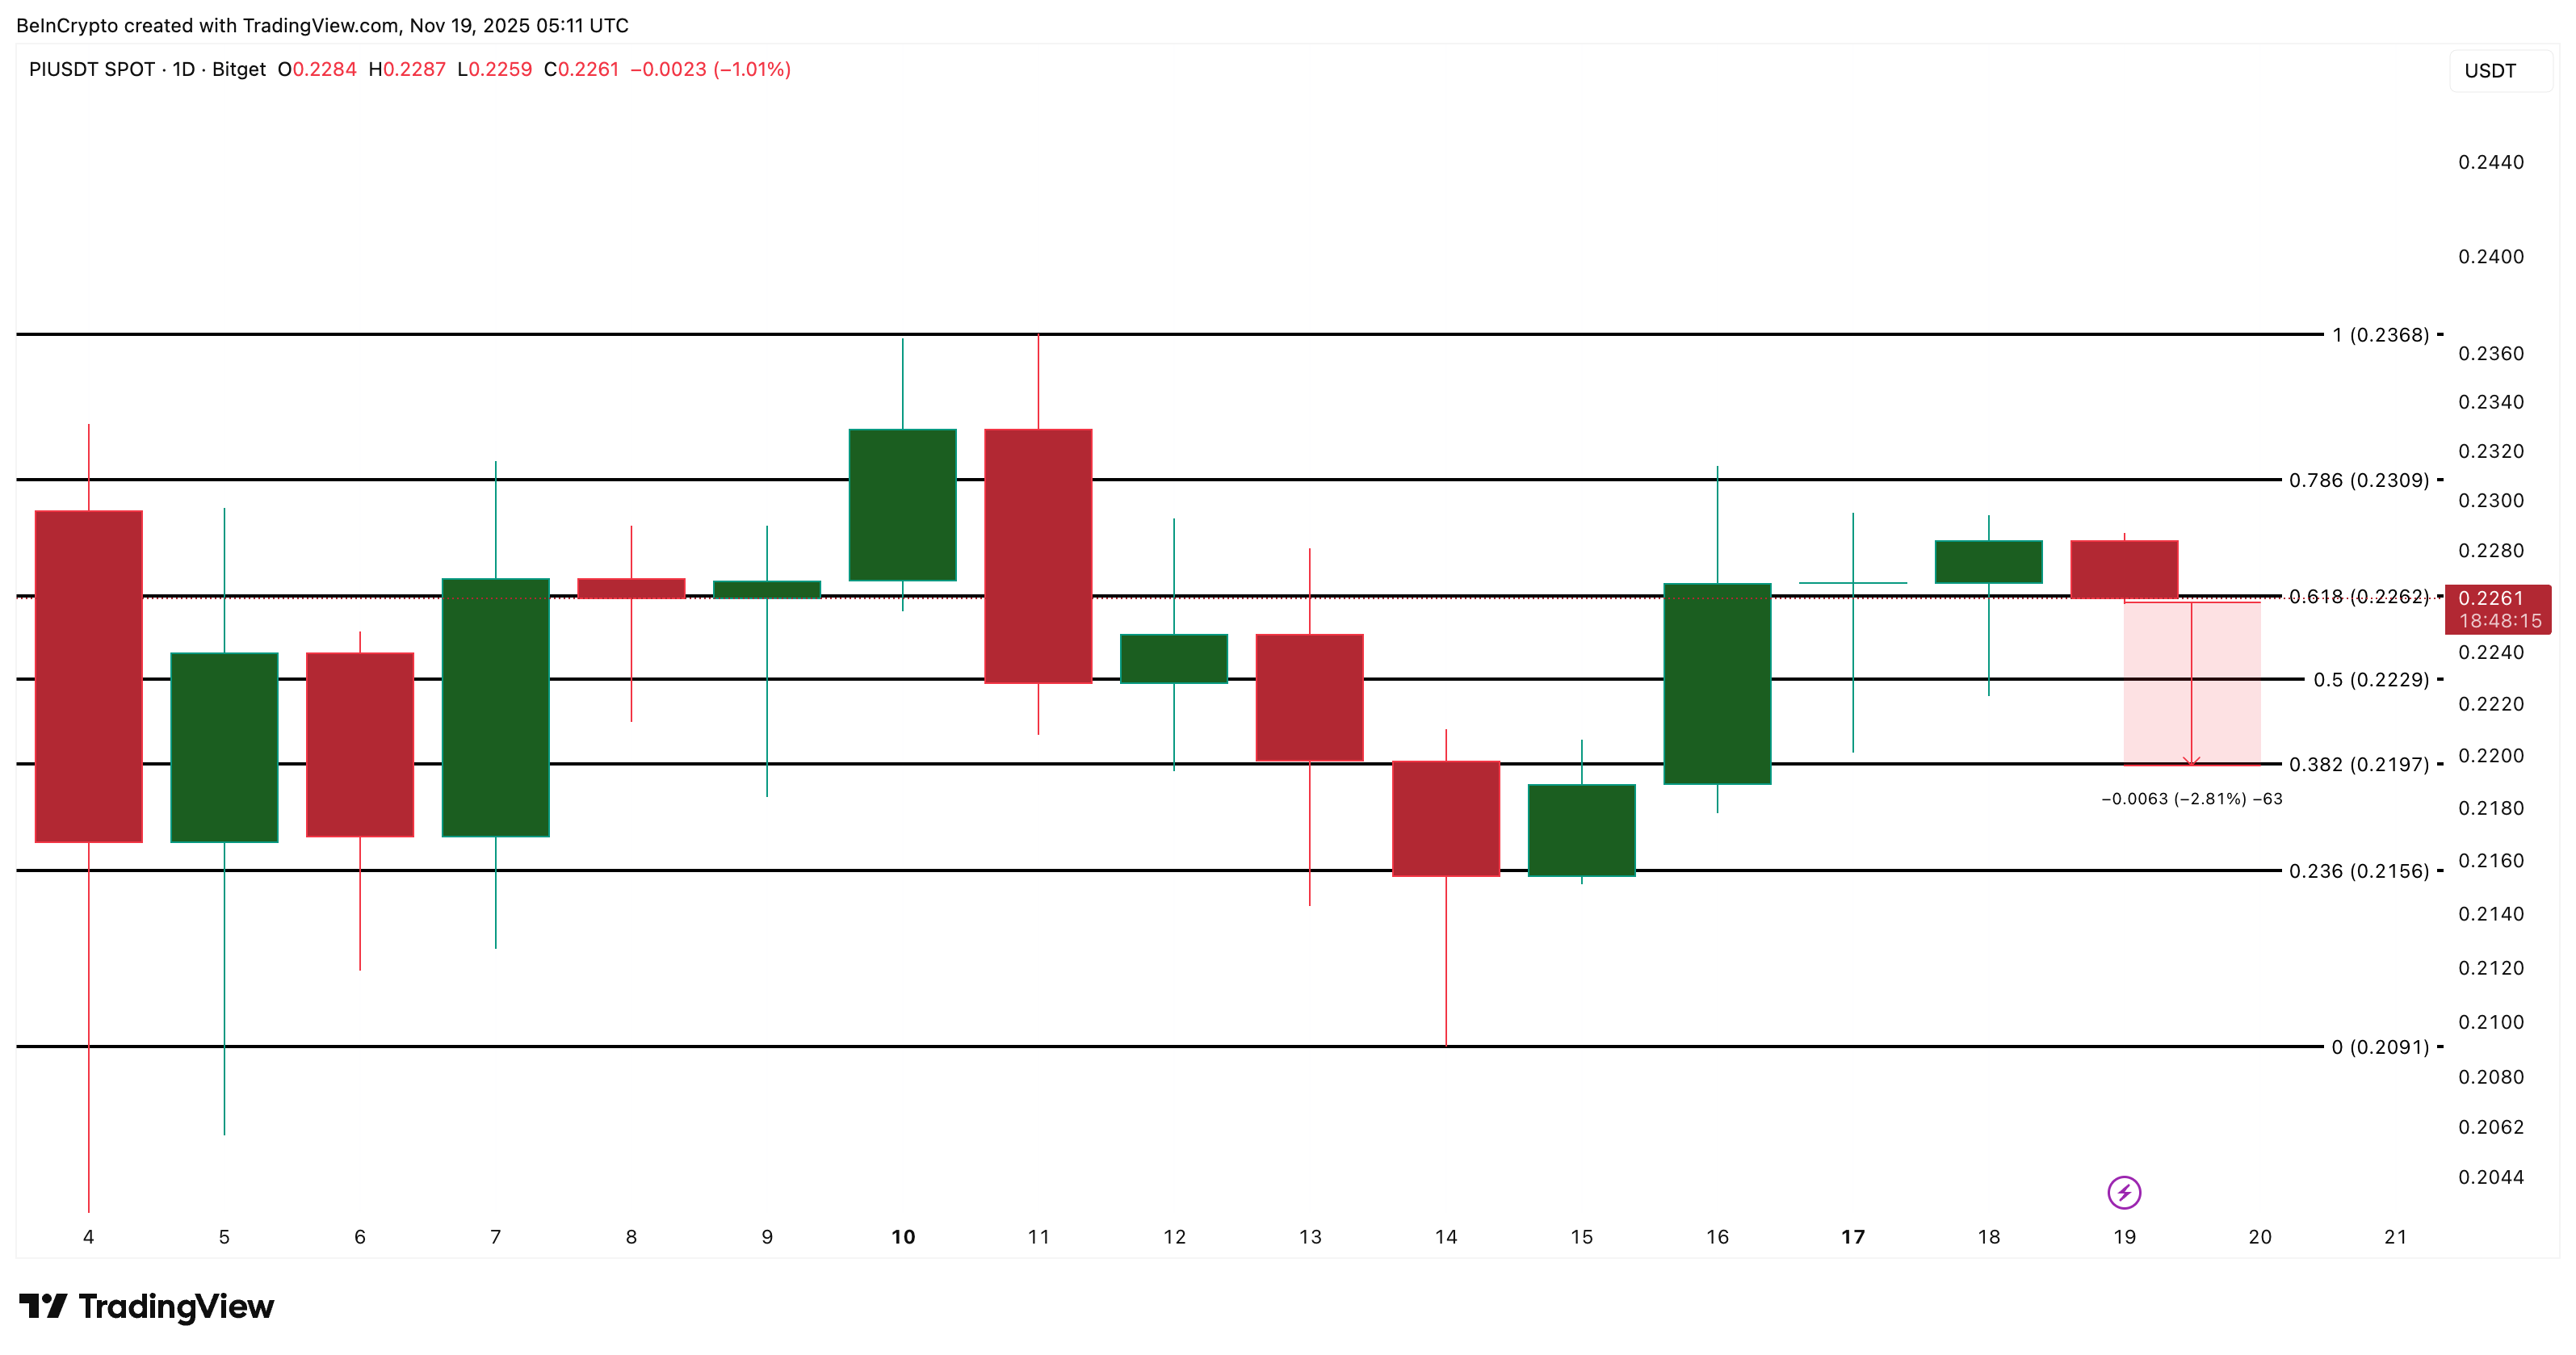
Pi Coin price is still up about 9% over the past month, but the short-term picture has started to soften. PI trades near $0.226 today, almost flat over the past 24 hours. Traders may see this as stability, but the charts are flashing several signs that the rebound from $0.209 may be running out of steam.
These early signals suggest a pullback could come unless buyers regain control.
Chart Signals Hint At A Weakening Bounce
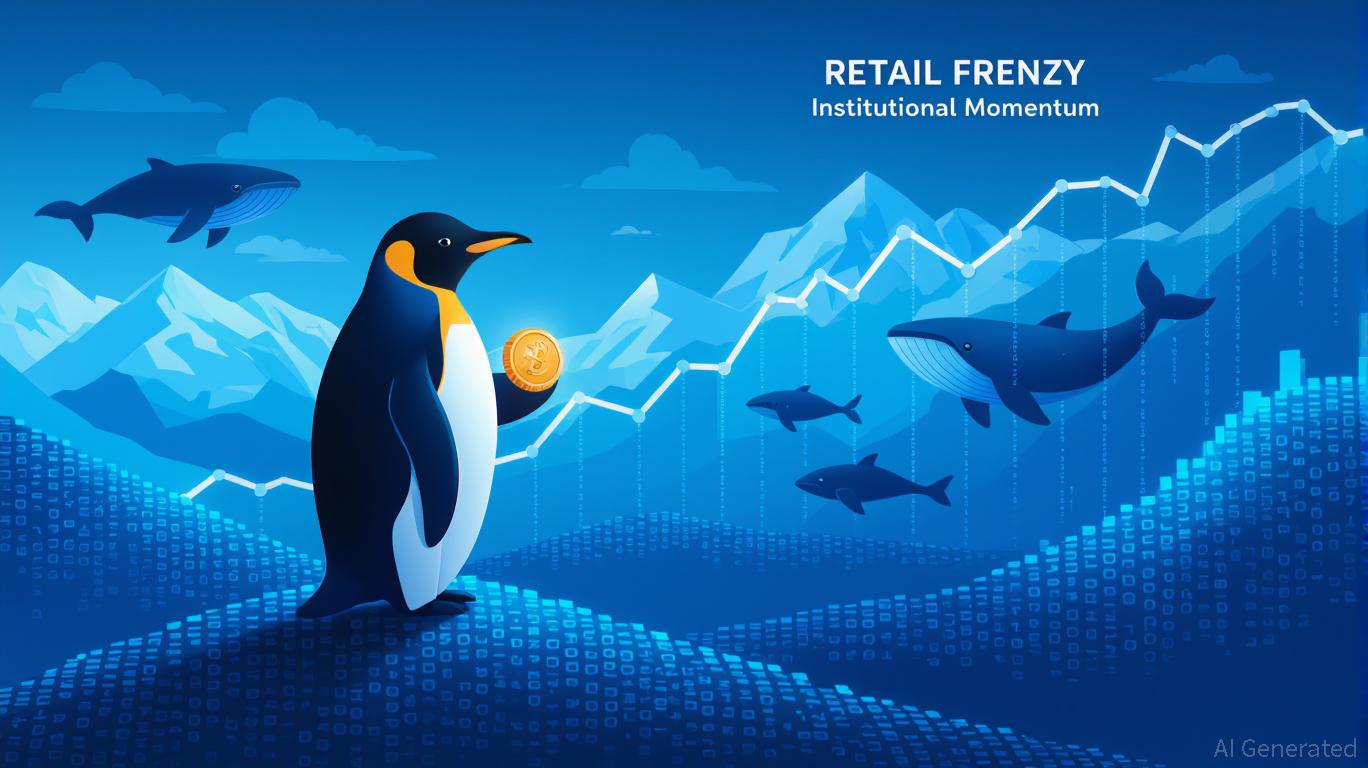
The first sign comes from a bearish engulfing pattern that formed on the daily Pi Coin chart. A bearish engulfing appears when a red candle fully covers the previous green candle. It often shows that sellers have regained control after buyers lose momentum.
Each time this pattern has appeared on Pi Coin since October 21, the price has dropped sharply, sometimes by 8% and sometimes by as much as 20%.
 Key Candlestick Patterns:
TradingView
Key Candlestick Patterns:
TradingView
Want more token insights like this? Sign up for Editor Harsh Notariya’s Daily Crypto Newsletter.
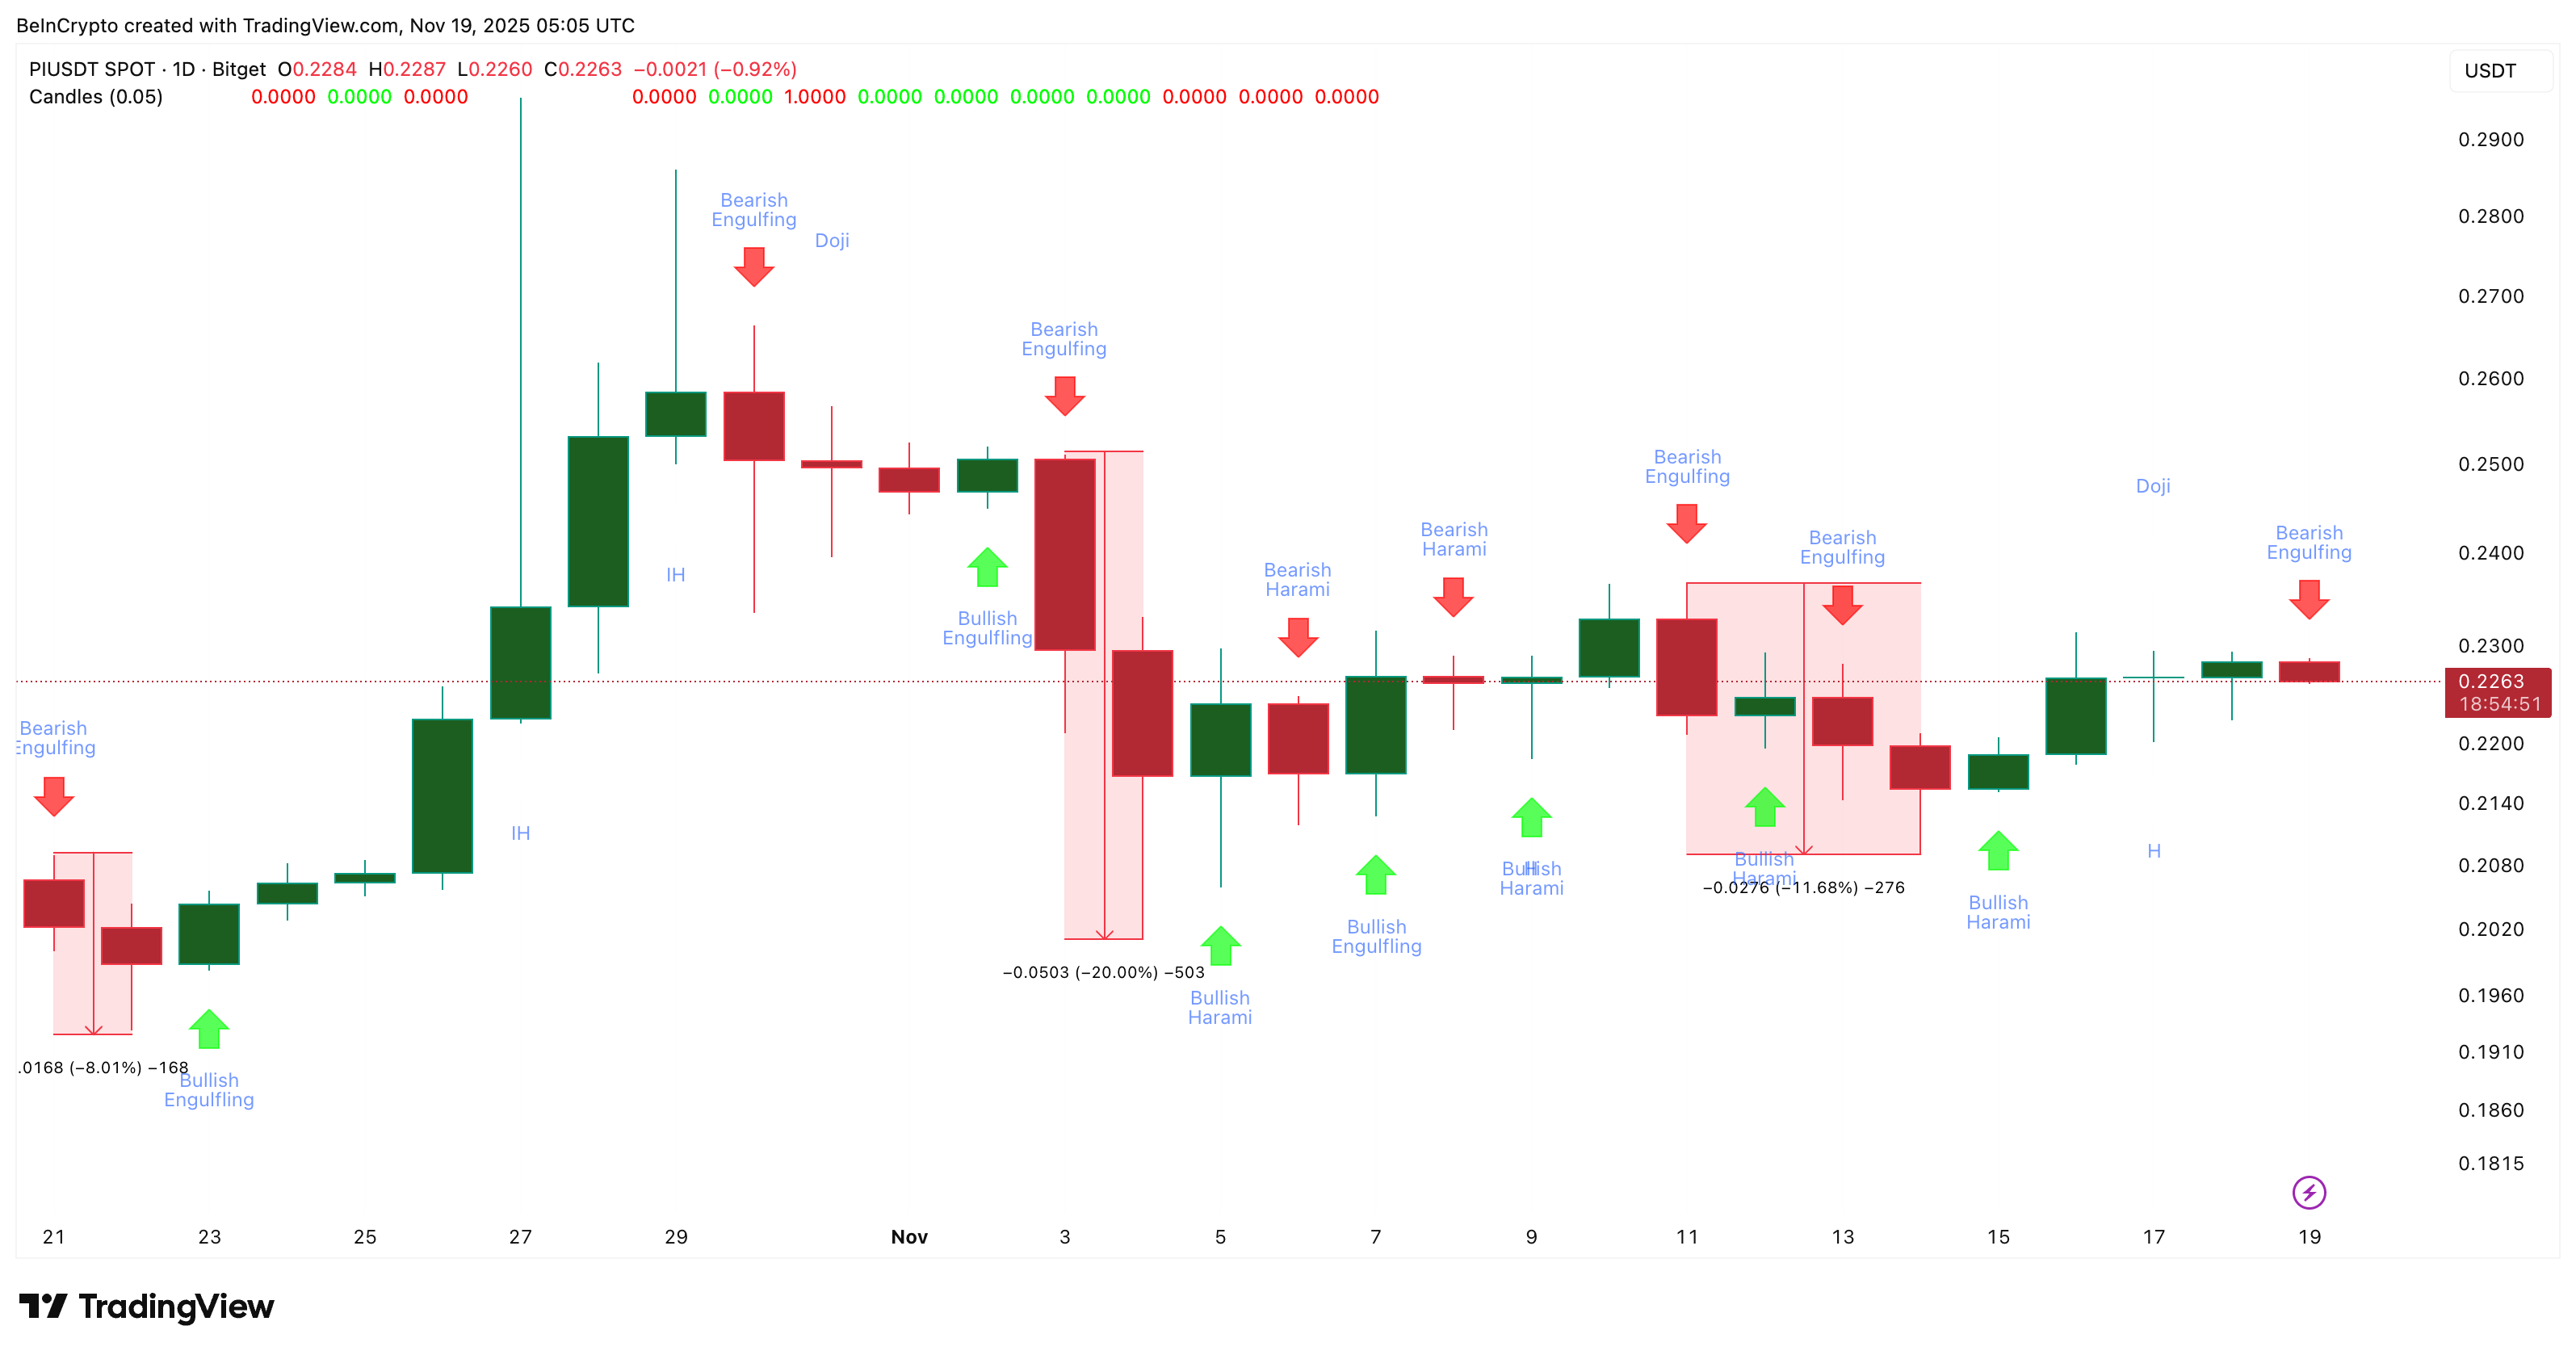
The second sign comes from the on-balance volume (OBV) indicator. OBV helps show whether real money is flowing into or out of a token.
Between November 14 and 18, OBV made higher lows while the price also made higher lows. That showed real buying support during the bounce. But OBV has now broken below the rising trend line that has supported it for days. If OBV falls under –1.36 billion, it will confirm a lower low on volume, which is already sell-biased. That shift usually happens when buyers lose strength and sellers take over, completely.
 Pi Coin Volume Takes A Hit:
TradingView
Pi Coin Volume Takes A Hit:
TradingView
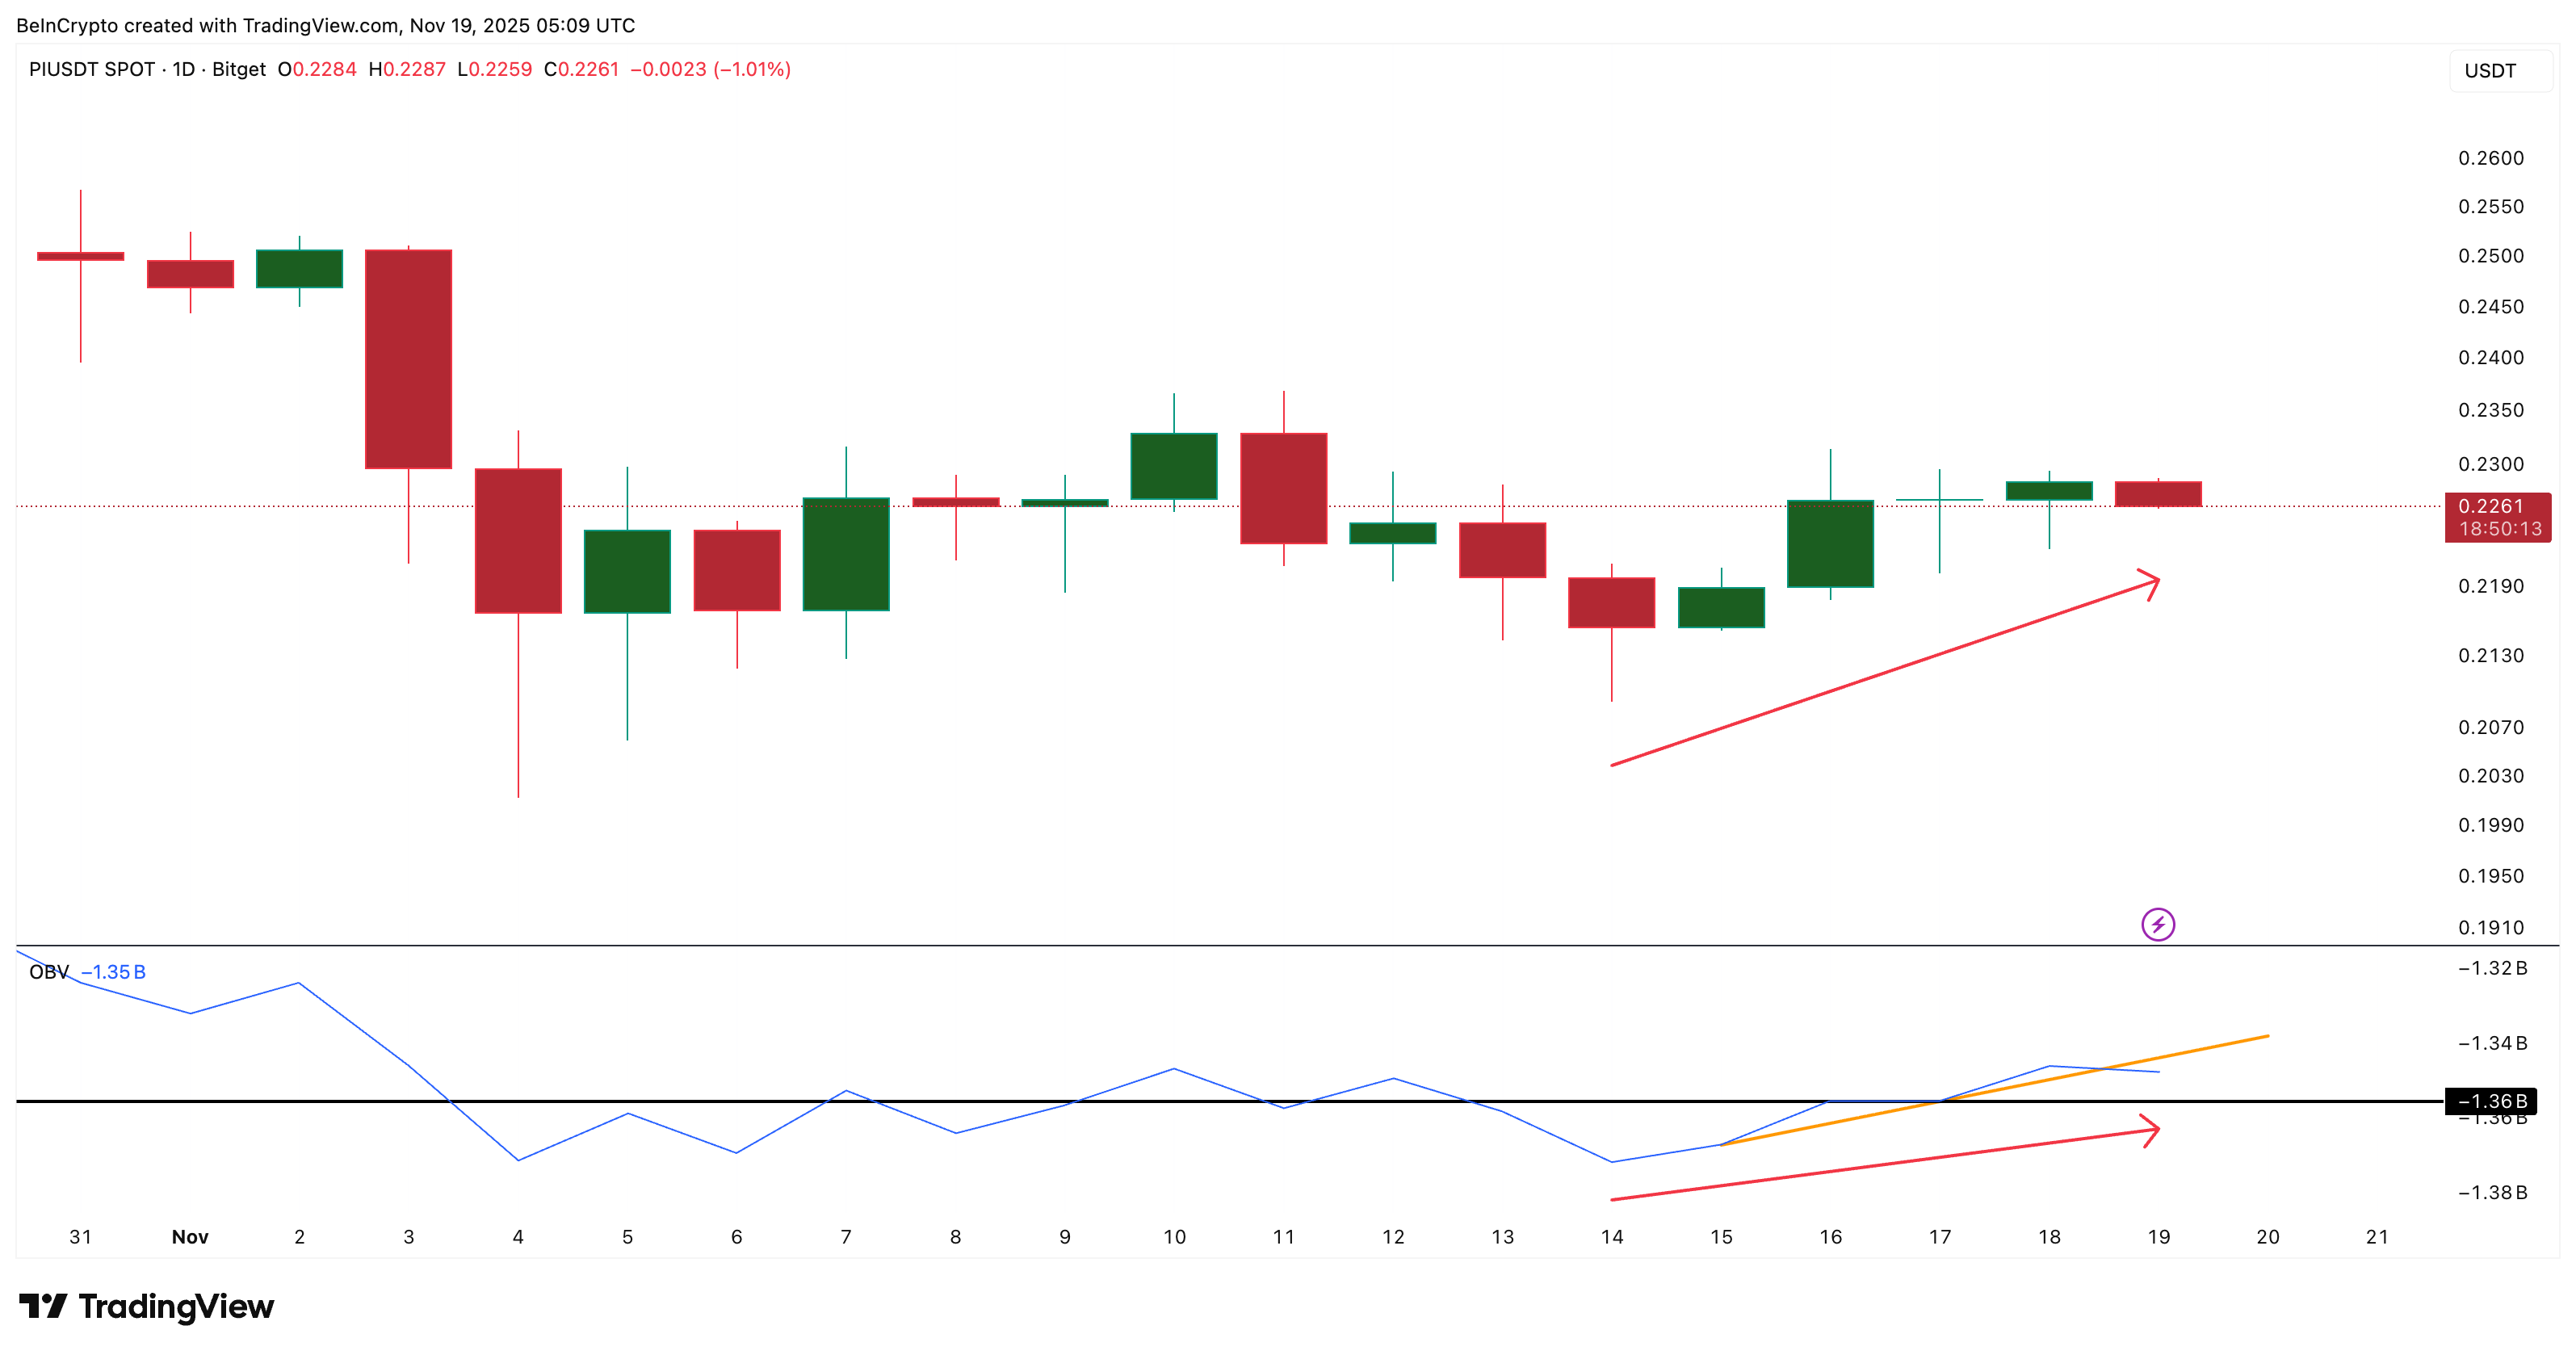
The third sign is a hidden bearish divergence on the Relative Strength Index (RSI). RSI measures buying strength.
Between November 16 and 18, the price made a lower high while the RSI made a higher high. This pattern is called hidden bearish divergence. It signals that the broader downtrend may still be in control and usually appears just before the next leg down in an ongoing downtrend.
 Hidden Bearish Divergence Flashes:
TradingView
Hidden Bearish Divergence Flashes:
TradingView
Together, these three signals show that Pi Coin’s recent bounce still sits inside a bigger downward structure.
Pi Coin Price Levels That Matter Now
If a deeper pullback starts, the first key level PI must protect is $0.219. Holding above this level keeps the bounce alive. Losing it opens the way toward $0.209, which is the base where the last rebound began.
If buyers want to invalidate the bearish signs, PI needs to reclaim $0.230 and then break $0.236 with strong volume. Only then would the short-term trend flip back to positive.
 Pi Coin Price Analysis:
TradingView
Pi Coin Price Analysis:
TradingView
Pi Coin price is still green on the monthly chart, but the latest structure suggests traders should stay cautious. The indicators show rising weakness, and unless PI clears its resistance soon, the pullback zone may come into play.
Read the article at BeInCryptoDisclaimer: The content of this article solely reflects the author's opinion and does not represent the platform in any capacity. This article is not intended to serve as a reference for making investment decisions.
You may also like
The Psychological Factors Influencing Retail Investors’ Actions in Cryptocurrency Markets
- Crypto markets are shaped by behavioral finance, where retail investors drive volatility through FOMO, herd behavior, and overconfidence. - The PENGU token exemplifies this dynamic, surging 480% in July 2025 but plummeting 28.5% by October due to emotional trading cycles. - Social media amplifies emotional contagion, with traders checking prices 14.5 times daily, while financial literacy mitigates bias susceptibility. - Personality traits like neuroticism increase cognitive biases, and speculative narrat

Bitcoin News Today: Bitcoin's Unstable Holiday Periods Hide Average Gains of 6%
- Bitcoin's Thanksgiving-to-Christmas performance shows equal odds of rising or falling, with a 6% average seasonal return despite volatility. - Historical extremes include a 50% 2020 rally and 2022's 3.62% drop post-FTX collapse, amid a $2.49-to-$91,600 long-term surge since 2011. - 2025's $91,600 price reflects ongoing recovery from 2024's $95,531 peak, with institutional crypto adoption and macroeconomic factors shaping future trajectories. - Analysts advise dollar-cost averaging for retail investors, w
Australia Strikes a Balance Between Fostering Crypto Innovation and Safeguarding Investors with Updated Regulations
- Australia introduces 2025 Digital Assets Framework Bill to regulate crypto platforms under ASIC, creating "digital asset platform" and "tokenized custody platform" licenses. - The framework mandates custody standards, transparency requirements, and lighter regulations for small operators (<$5k per customer) to balance innovation with investor protection. - Global alignment with UAE and EU crypto regulations is emphasized, while addressing risks from past failures like FTX through stricter enforcement and

PENGU Token's Latest Price Fluctuations and Blockchain Indicators: An Analytical Perspective on Technical Factors and Institutional Activity
- PENGU token's recent volatility and on-chain activity spark debate over institutional involvement in the crypto market. - Technical indicators show conflicting signals: overbought RSI vs. positive MACD/OBV momentum since November 2025. - Whale accumulation and Solana integration suggest strategic buying, while team wallet outflows highlight market uncertainty. - Social media sentiment drives short-term price swings, but structural risks like tokenomics and regulatory ambiguity persist. - Institutional ad