Pi Coin Holds Gains in a Red Market — Another Breakout At 6.5%?

Pi Coin is one of the few assets holding green while much of the crypto market stays red this month. Bitcoin is down about 20% and Ethereum has dropped nearly 27% month-on-month. Pi Coin price, once seen as a weaker project, is still up almost 18% in the same period. Even after today’s 5% dip,
Pi Coin is one of the few assets holding green while much of the crypto market stays red this month. Bitcoin is down about 20% and Ethereum has dropped nearly 27% month-on-month. Pi Coin price, once seen as a weaker project, is still up almost 18% in the same period.
Even after today’s 5% dip, its monthly trend remains positive. This unusual strength now puts Pi Coin (PI) only 6.5% away from a fresh breakout attempt. Here’s how!
Money Flow Strengthens The Uptrend
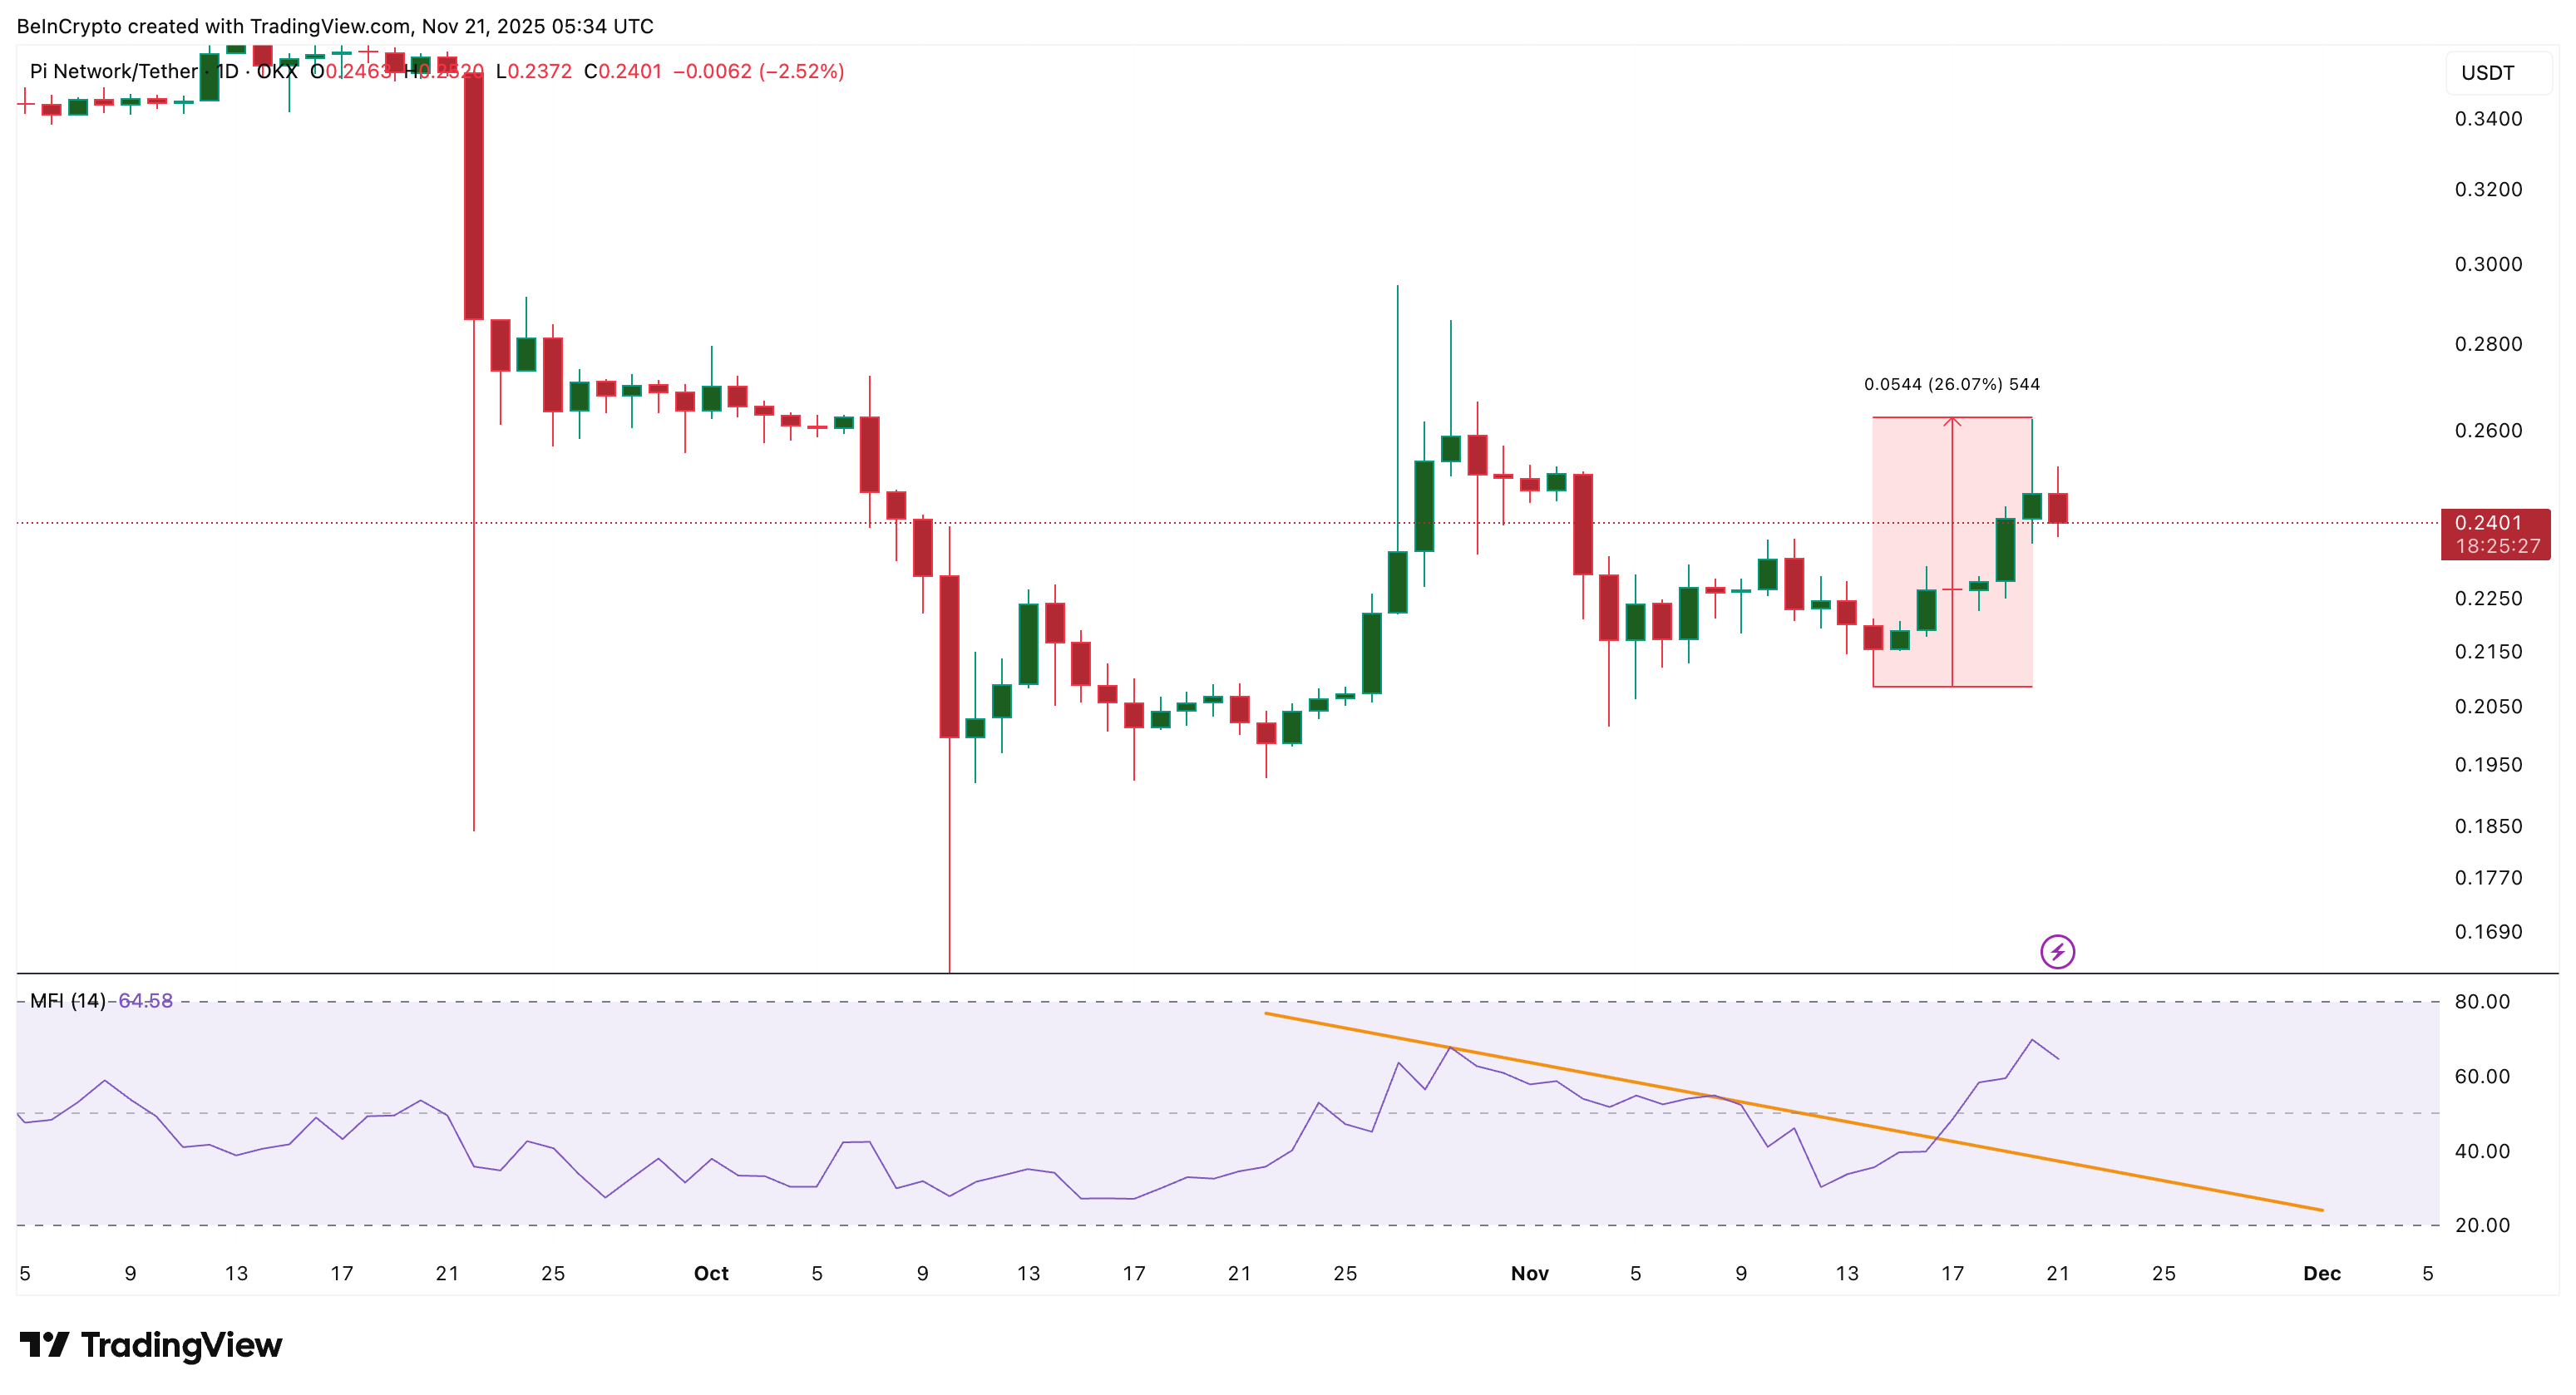
The first sign of strength comes from the Money Flow Index (MFI). MFI uses both price and volume to show if buyers or sellers are in control. Pi Coin broke above its MFI trend line on November 16, right as the price started rising.
Since November 14, Pi Coin has climbed almost 26%, and the MFI breakout confirmed that buyers were active early. The indicator has pulled back slightly, but it is still above its trend line. As long as it stays above it, dips are more likely to act as simple pullbacks instead of full reversals.
 Dip Buying Continues:
Want more token insights like this? Sign up for Editor Harsh Notariya’s Daily Crypto Newsletter here.
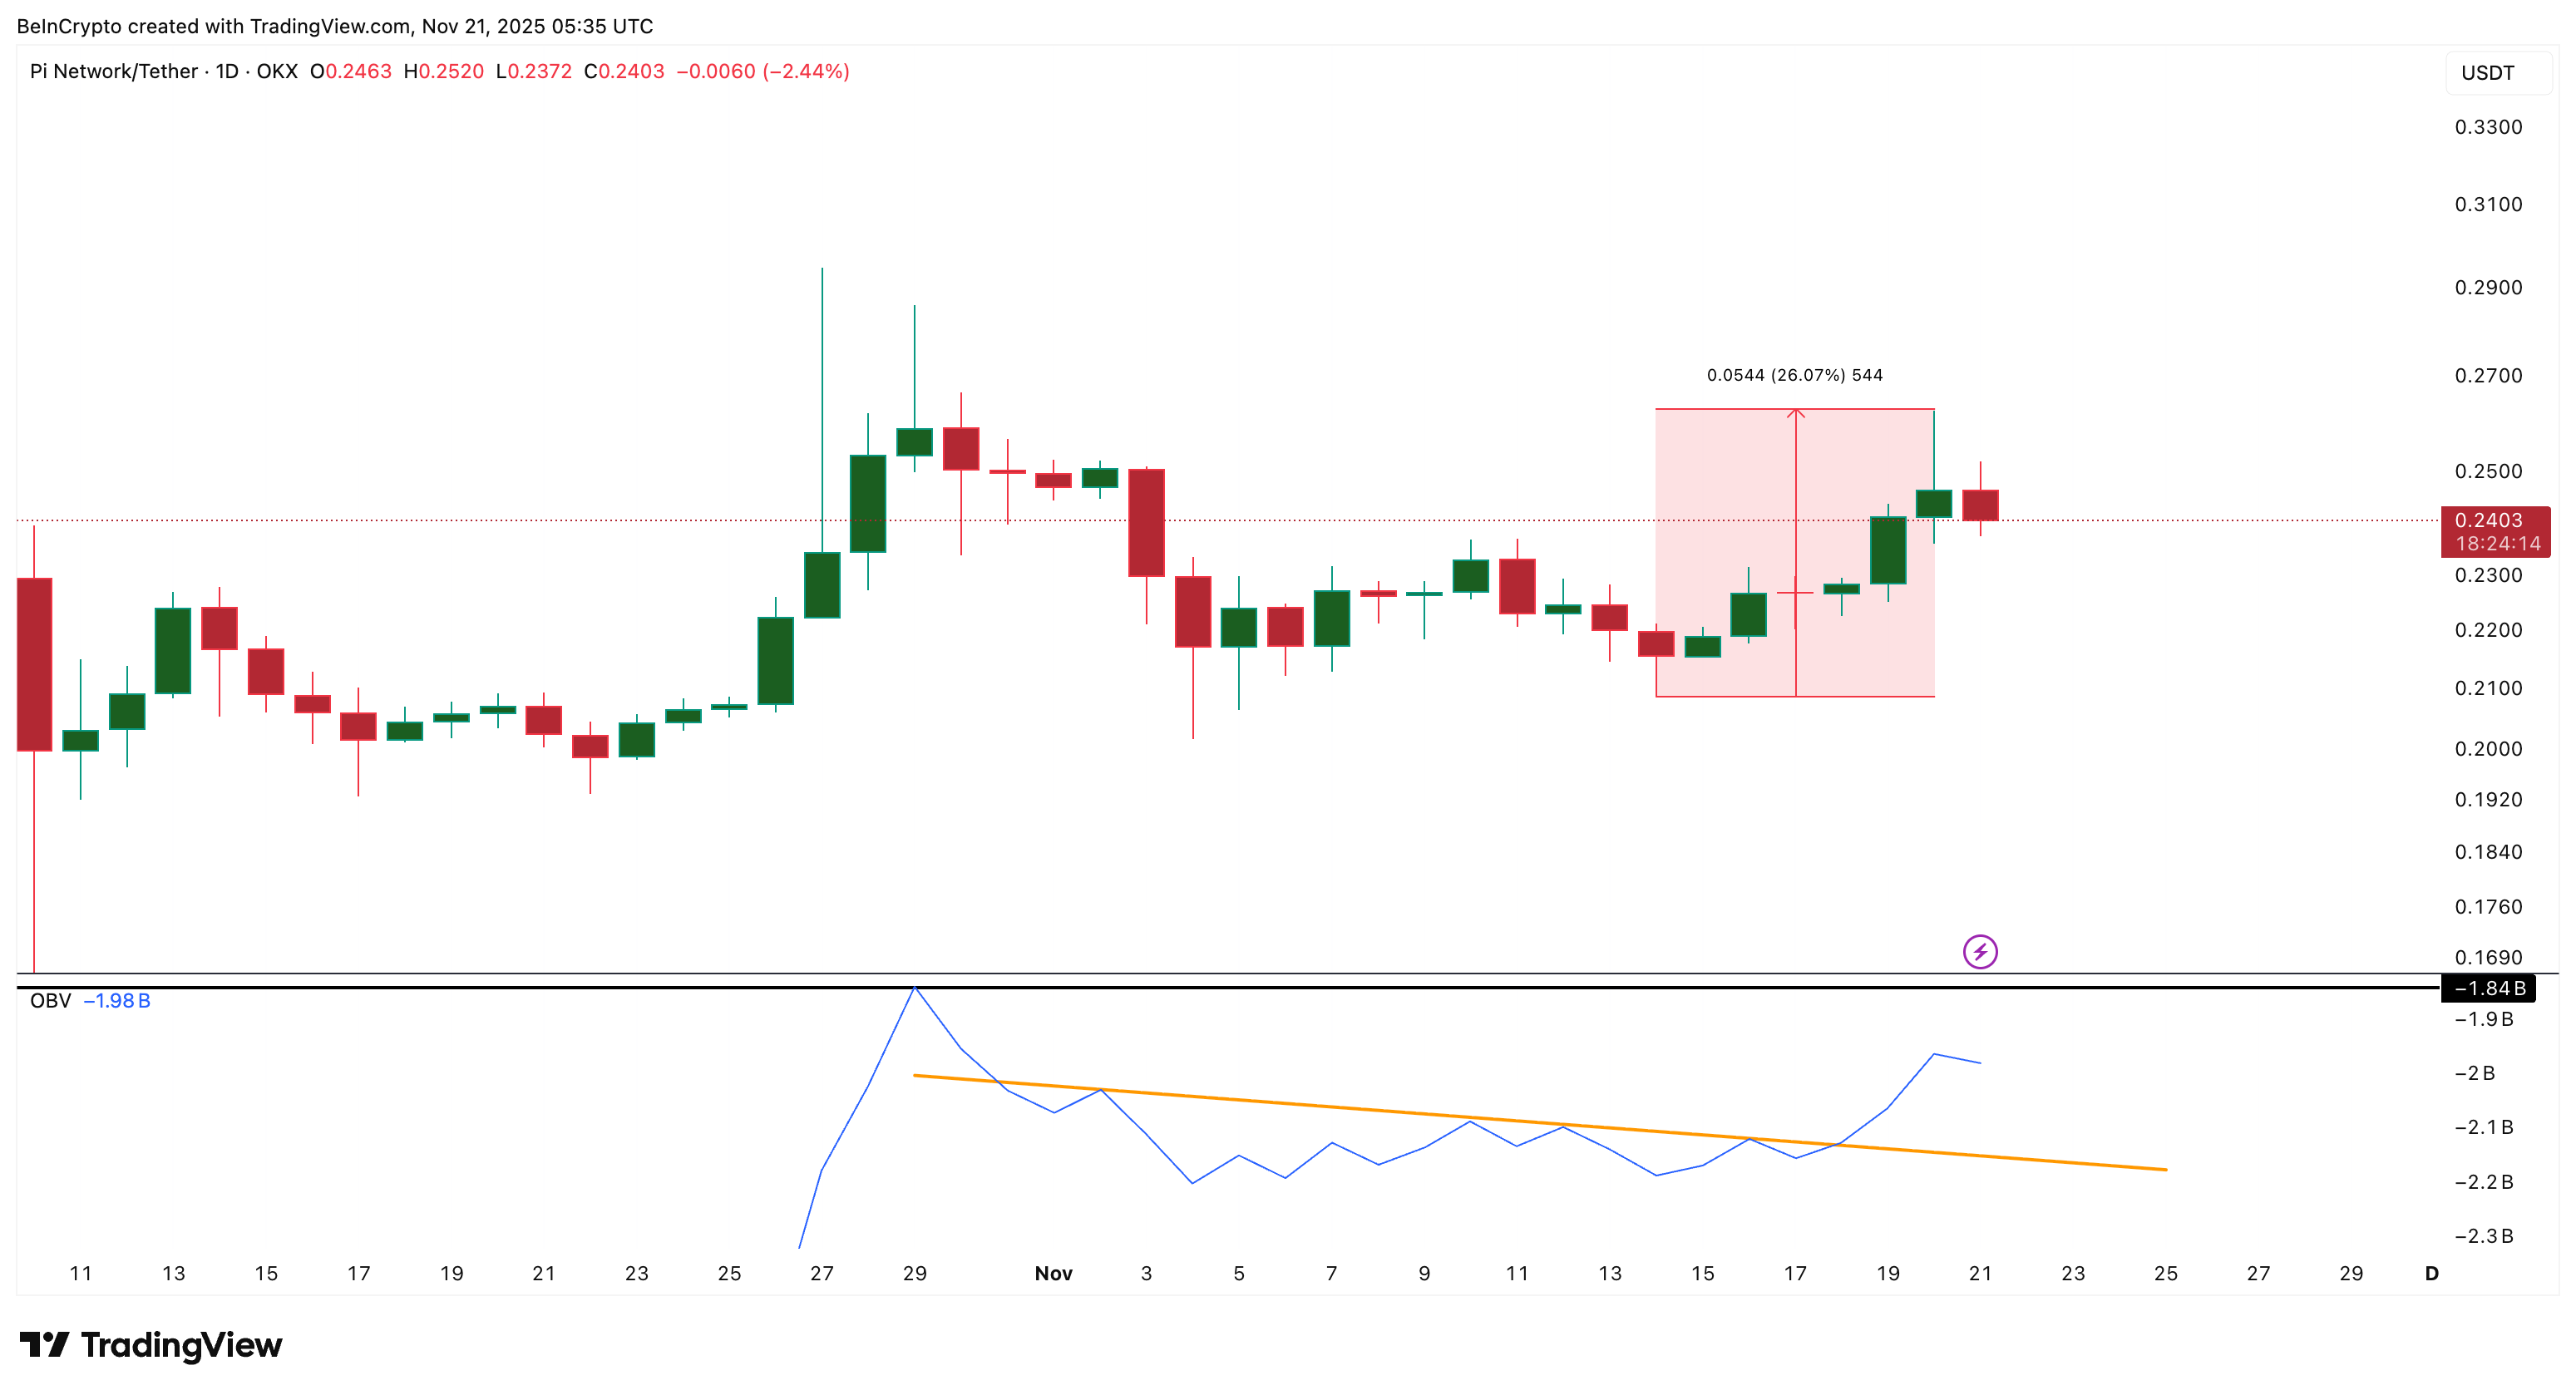
Volume flow supports this idea as well. The On-Balance Volume line (OBV) broke its trend line on November 18, two days after the MFI breakout. OBV tracks whether more volume is flowing into the asset or out of it.
A late OBV breakout usually means smaller traders joined after larger wallets took the first step. OBV is still in negative territory near –1.84 billion, a common feature of downtrends. Do note that the PI price trend still points down in the long term, as it’s down by over 30% in the last three months.
 Volume Backs The PI Story:
The upward OBV slope shows improving demand. Clearing –1.84 billion would strengthen the short-term trend.
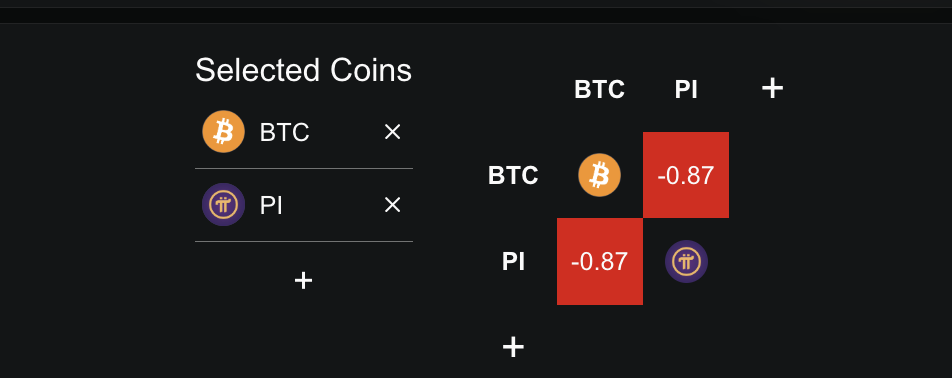
A rare detail adds more weight: PI’s seven-day correlation with Bitcoin sits near –0.87. This is the Pearson coefficient, which measures whether two assets move together. A reading close to –1 means they move in opposite directions.
 PI-BTC Correlation:
That explains why Pi Coin has remained green while Bitcoin and other large caps fell. If BTC continues to correct, the Pi Coin price might see more upside, per this theory.
An Upcoming Crossover Builds a Bullish Case
The 4-hour chart adds to the bullish argument. Pi Coin trades above all major exponential moving averages. The 50-period average is moving closer to the 200-period average.
 Pi Coin Could Extend Gains In The Short-Term:
If the 50 crosses above the 200, the structure forms what traders call a golden crossover. It usually means short-term strength is catching up to long-term trend direction. This setup supports the idea that Pi Coin’s uptrend still has room.
Exponential moving average (EMA) gives more weight to recent price data, so it reacts faster than simple moving averages.
Pi Coin Price Levels to Watch
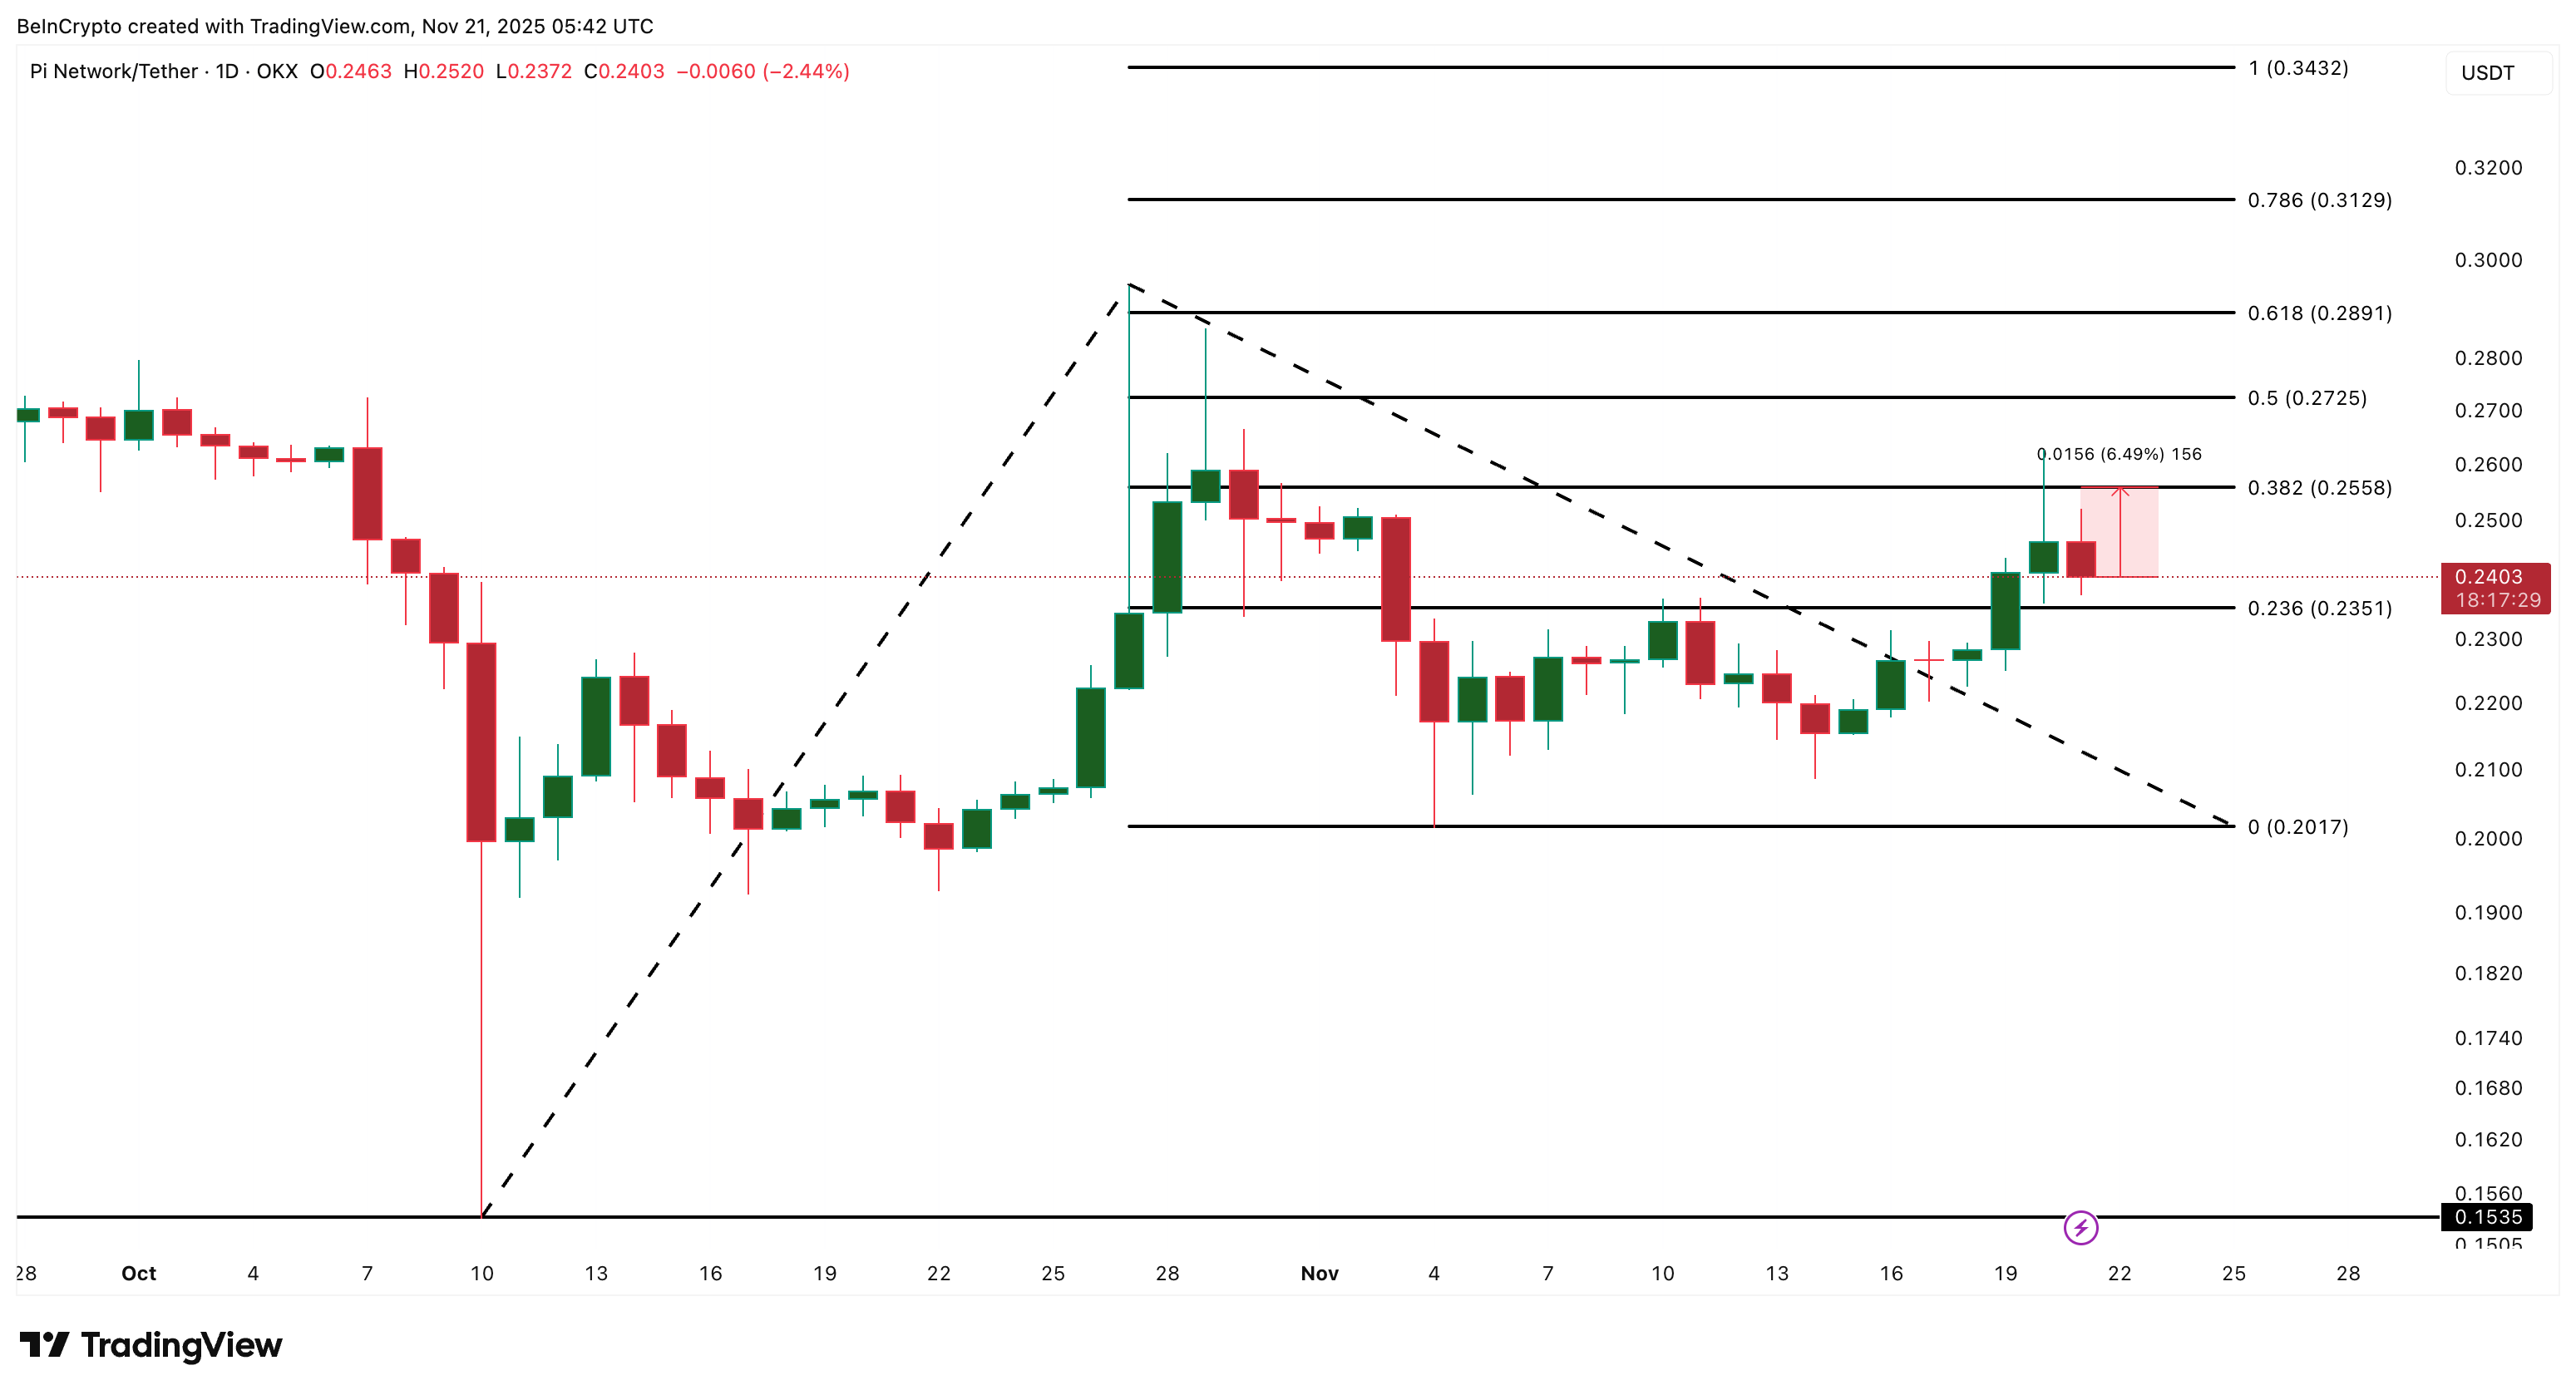
Trend-based Fibonacci extensions show the next resistance near $0.25. Pi Coin needs a clean daily close above this level to unlock the next wave higher. That requires a move of roughly 6.5% from the current price. Crossing $0.25 might allow Pi Coin’s rally to extend higher, with even $0.31 and $0.34 in contention.
On the downside, the key support sits near $0.23. Losing it on a daily close increases the risk of a drop toward $0.20, which would wipe out most of Pi Coin’s recent gains.
 Pi Coin Price Analysis:
For now, Pi Coin remains one of the rare green assets in a red market, on a monthly timeframe. If buyers can push it 6.5% higher, another breakout attempt may be just ahead.
Disclaimer: The content of this article solely reflects the author's opinion and does not represent the platform in any capacity. This article is not intended to serve as a reference for making investment decisions.
You may also like
Bitcoin Updates: Crypto ETPs Signal Market Growth as Leverage Shares Debuts on SIX
- Leverage Shares launched the world's first 3x leveraged and -3x inverse Bitcoin/Ethereum ETPs on SIX Swiss Exchange, expanding its crypto product range to 452 offerings. - The EUR/USD-traded ETPs target sophisticated investors seeking directional exposure, aligning with SIX's 19% YoY crypto ETP turnover growth to CHF 3.83 billion. - Market timing raises concerns as Bitcoin/Ethereum fell 21%/26% in November 2025, with experts warning leveraged products could amplify losses during volatility. - SIX's regul
Ethereum Updates Today: Buterin Moves ETH to Safeguard Privacy Against Major Financial Players and Quantum Threats
- Ethereum co-founder Vitalik Buterin donated 128 ETH ($760,000) to privacy-focused apps Session and SimpleX Chat, emphasizing decentralized metadata protection and user-friendly access. - Recent 1,009 ETH transfer to Railgun protocol sparked speculation about asset reallocation, though control remains with Buterin amid mixed Ethereum price trends. - Buterin warns of existential risks: 10.4% institutional Ether ownership and quantum computing threats by 2028, advocating layered security for Ethereum's desi

The Psychological Factors Influencing Retail Investors’ Actions in Cryptocurrency Markets
- Crypto markets are shaped by behavioral finance, where retail investors drive volatility through FOMO, herd behavior, and overconfidence. - The PENGU token exemplifies this dynamic, surging 480% in July 2025 but plummeting 28.5% by October due to emotional trading cycles. - Social media amplifies emotional contagion, with traders checking prices 14.5 times daily, while financial literacy mitigates bias susceptibility. - Personality traits like neuroticism increase cognitive biases, and speculative narrat

Bitcoin News Today: Bitcoin's Unstable Holiday Periods Hide Average Gains of 6%
- Bitcoin's Thanksgiving-to-Christmas performance shows equal odds of rising or falling, with a 6% average seasonal return despite volatility. - Historical extremes include a 50% 2020 rally and 2022's 3.62% drop post-FTX collapse, amid a $2.49-to-$91,600 long-term surge since 2011. - 2025's $91,600 price reflects ongoing recovery from 2024's $95,531 peak, with institutional crypto adoption and macroeconomic factors shaping future trajectories. - Analysts advise dollar-cost averaging for retail investors, w