Bitget App
Trade smarter
Buy cryptoMarketsTradeFuturesEarnSquareMore
XRP Slides to $2.07 After a 4.25% Market Cap Drop Highlights Rising Volatility and Dense Liquidity Clusters Near Key Price Levels

XRP Slides to $2.07 After a 4.25% Market Cap Drop Highlights Rising Volatility and Dense Liquidity Clusters Near Key Price Levels

CryptonewslandCryptonewsland2025/12/05 20:12
By:by Vee Peninah
  • XRP fell to $2.07 in 24 hours as market cap slipped to $125.33B, marking a 4.25% decline.
  • Liquidity maps showed dense activity between $2.10 and $2.20, shaping frequent intraday reactions.
  • Hourly indicators showed continued volatility, with RSI near 35.14 and 32.36, reflecting unstable momentum.

XRP’s market performance weakened over the past 24 hours as the asset recorded a fresh drop to $2.07. The fall was accompanied by a significant decrease in market capitalization, which dropped to the level of 125.33 billion following a decrease of 4.25%.

This change took place as trading data indicated more volatility over shorter periods, and liquidity maps were showing activity that was shifting around the area of $2.10. These flows preconditioned the new session, and they also influenced the short-term expectations on the market in general. Having these readings in place, traders were still monitoring price action keenly, particularly as the asset retested previous levels.

 XRP Pullback Deepens as Mid-Range Indicators Crosses Limit Directional Strength

The contraction in XRP’s market cap aligned with the confirmed 4.24% intraday price decline. This decline moved the asset away from earlier levels near $2.20, which remained visible on the volume heatmap. The pullback also followed a broader cooldown that developed throughout the previous trading day.
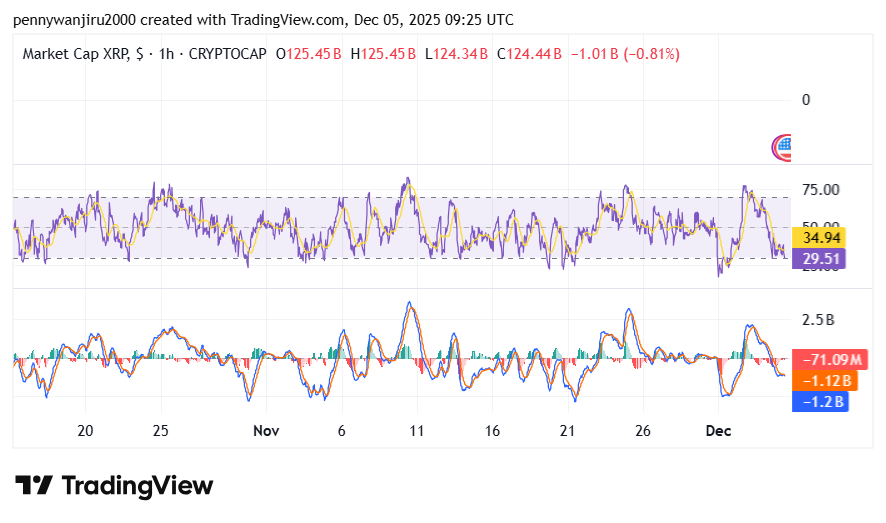
XRP Slides to $2.07 After a 4.25% Market Cap Drop Highlights Rising Volatility and Dense Liquidity Clusters Near Key Price Levels image 0 XRP Slides to $2.07 After a 4.25% Market Cap Drop Highlights Rising Volatility and Dense Liquidity Clusters Near Key Price Levels image 1 Source: TradingView

Moving to the momentum readings, hour-by-hour oscillators showed frequent shifts. RSI hovered within a middle range, with levels near 35.14 and 32.36 during the latest update. These readings indicated steady fluctuations, and they helped explain the limited directional pushes seen during the session.

Momentum indicators reinforced this pattern. Hourly MACD lines crossed several times, and each cross coincided with small shifts in volume bars. These signals highlighted unstable intraday behavior, especially as market participants adjusted positions during the decline.

Short-Term Trading Range Shows Increased Volatility

The chart also showed frequent swings within a narrow trading band. These swings became visible as XRP failed to hold earlier intraday recoveries. Price repeatedly revisited the lower region near $2.05, which aligned with several liquidity pockets on the heatmap.

$XRP liquidated a high leverage long positions. pic.twitter.com/b1AHSSDPAS

— CW (@CW8900) December 5, 2025

However, liquidity distribution added additional context. The heatmap displayed dense activity between $2.10 and $2.20, and this band showed frequent order clustering. This clustering influenced short-term moves and shaped intraday reactions when price approached those levels.

Moreover, repeated tests of nearby price levels continued to define the latest sessions. Notably, these movements followed a sequence of rapid adjustments recorded across the market cap chart, which reflected steady pressure through the early morning hours

Liquidity Patterns Highlight Key Near-Term Levels

Liquidity distribution offered additional insight into potential near-term behavior. Several bright clusters appeared slightly above the current price, especially around the $2.10 to $2.15 zone. These clusters suggested increased activity in that region, and they shaped the immediate trading landscape.

This landscape remained important because each cluster marked areas where price stalled several times earlier. Market participants monitored these areas closely as XRP hovered near $2.07. Furthermore, the market cap decline placed more attention on how liquidity concentrated at these levels. As the next sessions unfold, these concentrations and the repeated intraday reactions will likely guide short-term movements.

0
0

Disclaimer: The content of this article solely reflects the author's opinion and does not represent the platform in any capacity. This article is not intended to serve as a reference for making investment decisions.

PoolX: Earn new token airdrops
Lock your assets and earn 10%+ APR
Lock now!

You may also like

Vitalik Buterin Backs ZKsync: Driving Institutional-Level Ethereum Scalability

- Vitalik Buterin's endorsement of ZKsync's Atlas upgrade boosts Ethereum's L2 scalability and institutional adoption. - ZKsync's 15,000 TPS and $15B in institutional investments highlight its institutional-grade performance and token economics. - Enterprise partnerships and RWA projects position ZKsync as a cost-effective alternative to Arbitrum, challenging its 45% TVL dominance. - Planned Fusaka upgrade and Buterin's ZK advocacy aim to enhance Ethereum's scalability and value capture without compromisin

Bitget-RWA2025/12/10 11:52
Vitalik Buterin Backs ZKsync: Driving Institutional-Level Ethereum Scalability

Zcash Halving: What It Means for Cryptocurrency Investors in 2025

- Zcash's 2028 halving will reduce annual inflation to 1%, reinforcing its deflationary model after prior 50% block reward cuts in 2020 and 2024. - The 2024 halving triggered 1,172% price surge followed by 96% drop, highlighting volatility risks despite growing institutional investments like Grayscale's $137M Zcash Trust. - Privacy-focused hybrid model (shielded/transparent transactions) attracts institutional interest but faces EU MiCA regulatory scrutiny, requiring selective compliance strategies. - Inve

Bitget-RWA2025/12/10 10:24

CleanTrade and the Evolution of Clean Energy Markets: Market Fluidity, Openness, and the Role of the CFTC

- CleanTrade, a CFTC-approved SEF, transforms clean energy markets by integrating VPPAs, PPAs, and RECs under institutional-grade transparency. - The platform unlocks liquidity through real-time pricing and centralized trading, accelerating net-zero transitions for corporations and utilities . - Enhanced transparency via project-specific REC data combats greenwashing, while regulatory alignment boosts investor confidence and market legitimacy. - By bridging traditional and renewable energy markets, CleanTr

Bitget-RWA2025/12/10 10:24
CleanTrade and the Evolution of Clean Energy Markets: Market Fluidity, Openness, and the Role of the CFTC

The CFTC-Authorized Clean Energy Marketplace: An Innovative Gateway for Institutional Investors

- REsurety’s CleanTrade platform, CFTC-approved as a SEF, addresses clean energy market illiquidity and opacity by centralizing VPPAs, PPAs, and RECs. - Within two months of its 2025 launch, it attracted $16B in notional value, enabling institutional investors to streamline transactions and reduce counterparty risk. - By aggregating market data and automating compliance, CleanTrade enhances transparency, aligning with ESG priorities and regulatory certainty for institutional portfolios. - It democratizes a

Bitget-RWA2025/12/10 09:32
The CFTC-Authorized Clean Energy Marketplace: An Innovative Gateway for Institutional Investors
© 2025 Bitget