
On-chain analyst TechDev: Bitcoin RSI channel history reappears, new cycle signals emerge clearly
TechDev2024/12/23 03:45
By:TechDev
Bitget offers one-stop trading for cryptocurrencies, stocks, and gold. Trade now!
A welcome pack worth 6200 USDT for new users! Sign up now!
The latest
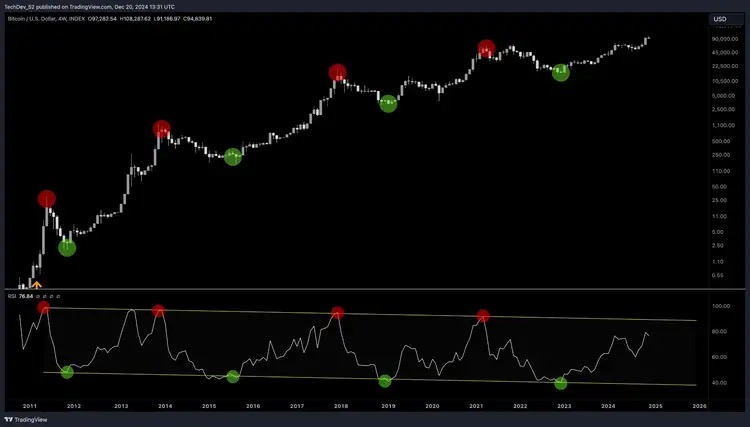
Bitcoin price and RSI channel analysis chart released by on-chain analyst TechDev shows that since 2011, the RSI indicator has been running in a long-term downward channel, clearly revealing the inflection point pattern of market tops and bottoms.
From the chart, the top area of the RSI marked in red accurately captures the bull market peaks of 2013, 2017, and 2021, all of which occurred when the RSI touched the upper track of the channel; the bottom marked in green perfectly corresponds to the bear market lows of 2015, 2018, and 2023, which occurred when the RSI touched the lower track of the channel.
TechDev pointed out that the RSI is gradually rising and there is still some room for improvement from the top of the channel, indicating that the market may be in the middle stage of a bull market. This revalidation of cyclical patterns provides a strong reference for the Bitcoin after-market.
TechDev further explains: "The price cycle of the Bitcoin market and the changes in RSI are core tools for understanding long-term trends. As RSI steadily rises, market sentiment may further recover." However, he also reminds that although the RSI channel provides important cyclical signals, external macro environment and market volatility factors cannot be ignored.
0
2
Disclaimer: The content of this article solely reflects the author's opinion and does not represent the platform in any capacity. This article is not intended to serve as a reference for making investment decisions.
Understand the market, then trade.
Bitget offers one-stop trading for cryptocurrencies, stocks, and gold.
Trade now!
You may also like
Why crypto could face its first September test as U.S. labor data looms
AMBCrypto•2026/09/01 04:03
Gold declines as rising Fed hike bets and US‑Iran tensions support USD
FXStreet•2026/09/01 03:51
HBAR targets $0.34 as double-bottom pattern and RWA growth signal reversal
Cointurk•2026/09/01 03:51
Crypto prices
More
Bitcoin
BTC
$78,659.77
+1.30%

Ethereum
ETH
$2,470.31
+2.22%

Tether USDt
USDT
$0.9997
-0.01%

BNB
BNB
$693.33
+1.11%

XRP
XRP
$1.39
+2.62%

USDC
USDC
$0.9999
-0.01%

Solana
SOL
$103.61
+2.01%

TRON
TRX
$0.3322
-1.25%

Hyperliquid
HYPE
$84.37
+5.25%

Zcash
ZEC
$857.52
+4.95%
How to buy BTC
Bitget lists BTC – Buy or sell BTC quickly on Bitget!
Trade now
Become a trader now?A welcome pack worth 6200 USDT for new users!
Sign up now