
Mask Network price pumps then dumps as whales sell

Mask Network token surged to its highest point since December last year and then suffered a harsh reversal.
Mask Network (MASK), a privacy-focused token, rose to $3.6766, and then erased those gains and moved towards $2.
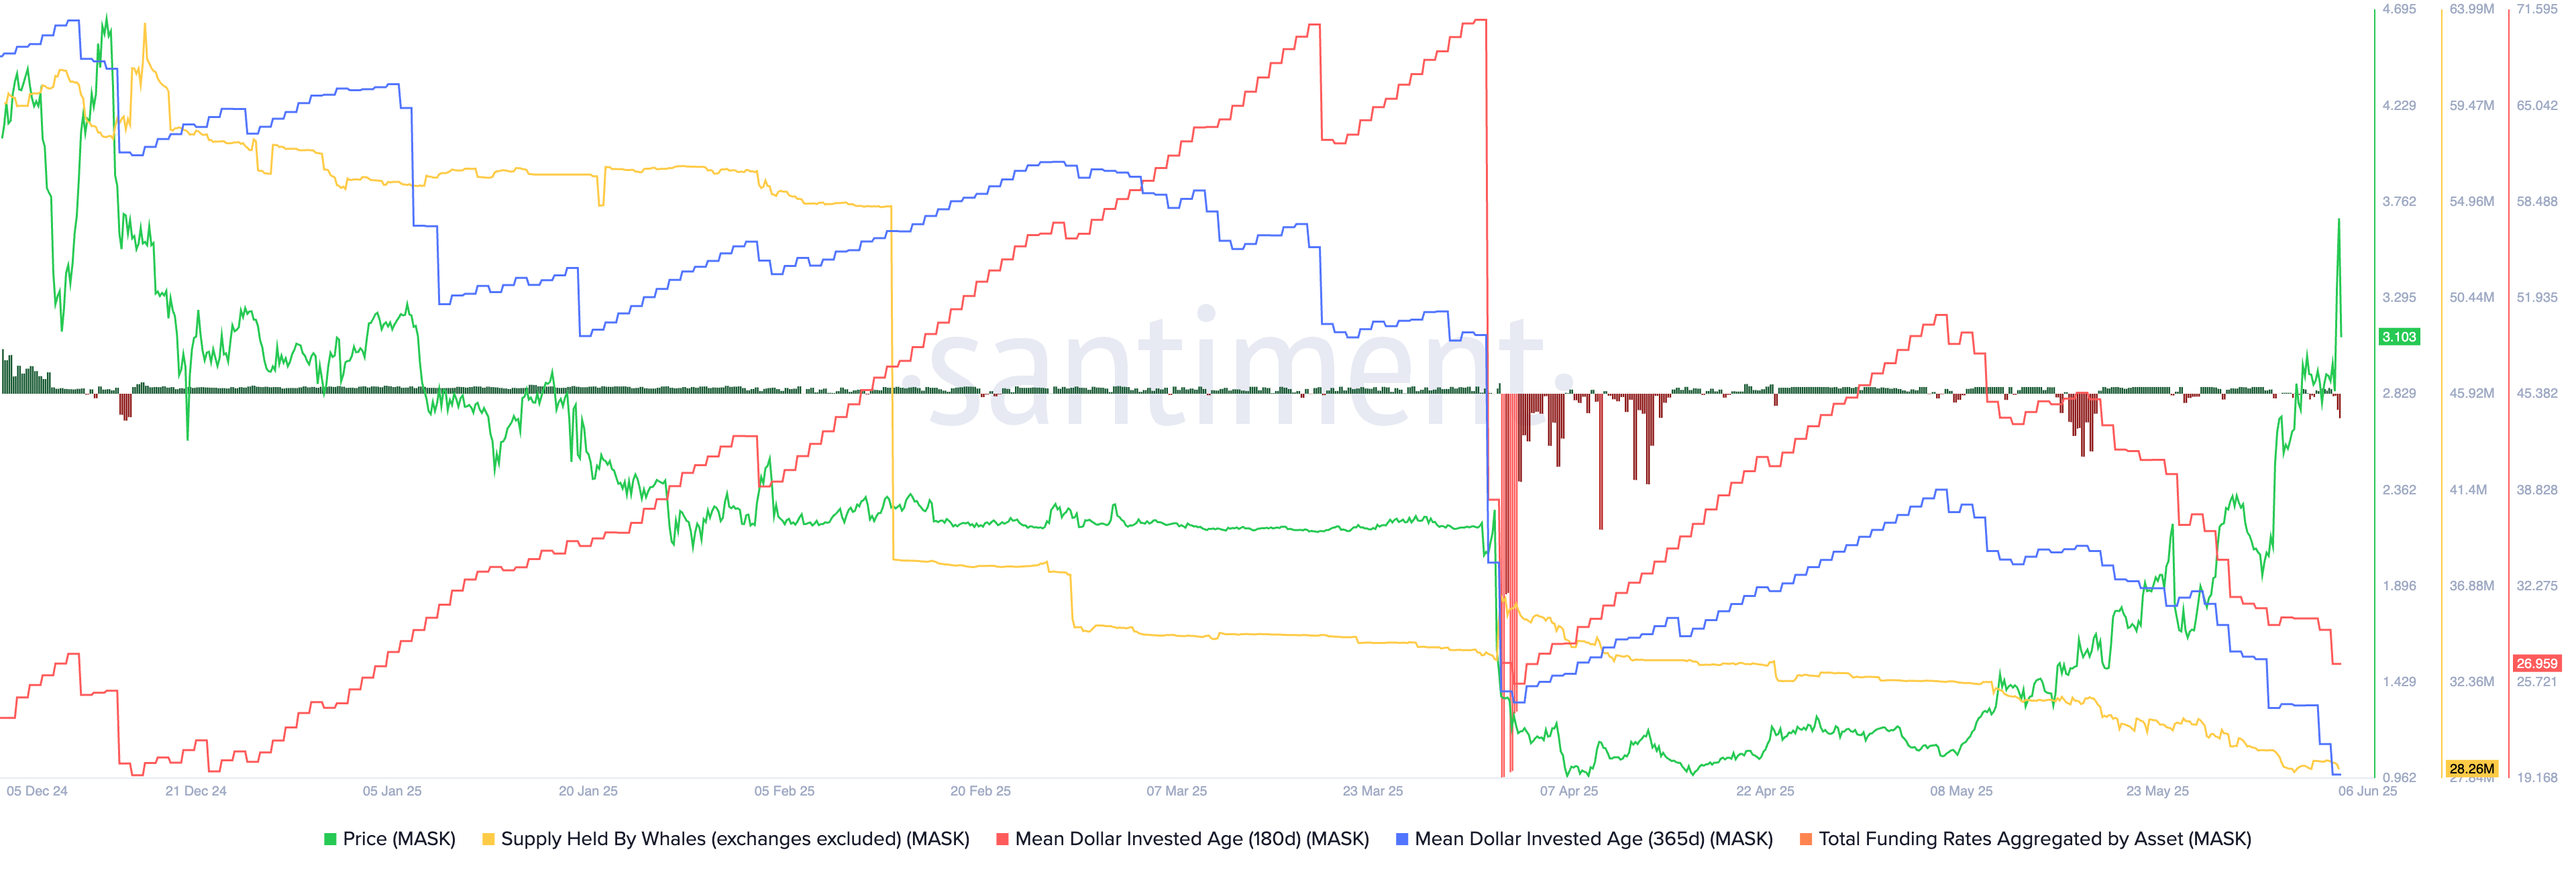
On-chain data shows that the whale transaction count jumped. Santiment data shows that these transactions jumped to 26, its highest point since May 28.
A deeper dive reveals that these whales are selling the Mask token. The supply of held by whales dropped to 28.26 million on Friday, the lowest level on record.
More data shows that the 180-day and 365-day mean dollar invested age or MDIA has been in a strong downward trend. The 180-day figure dropped to 29.6, down from 50 in May, while the 365-day figure plunged to 38 from 70.
The MDIA figure looks at the average age of all coins weighted by their purchase price in US dollar terms. A falling figure is usually a bearish sign for a cryptocurrency.
The other bearish sign for the Mask Network is its negative funding rate in the past few days. This happens when more traders are shorting an asset and are thus paying bullish ones a small fee.
Mask Network price technical analysis
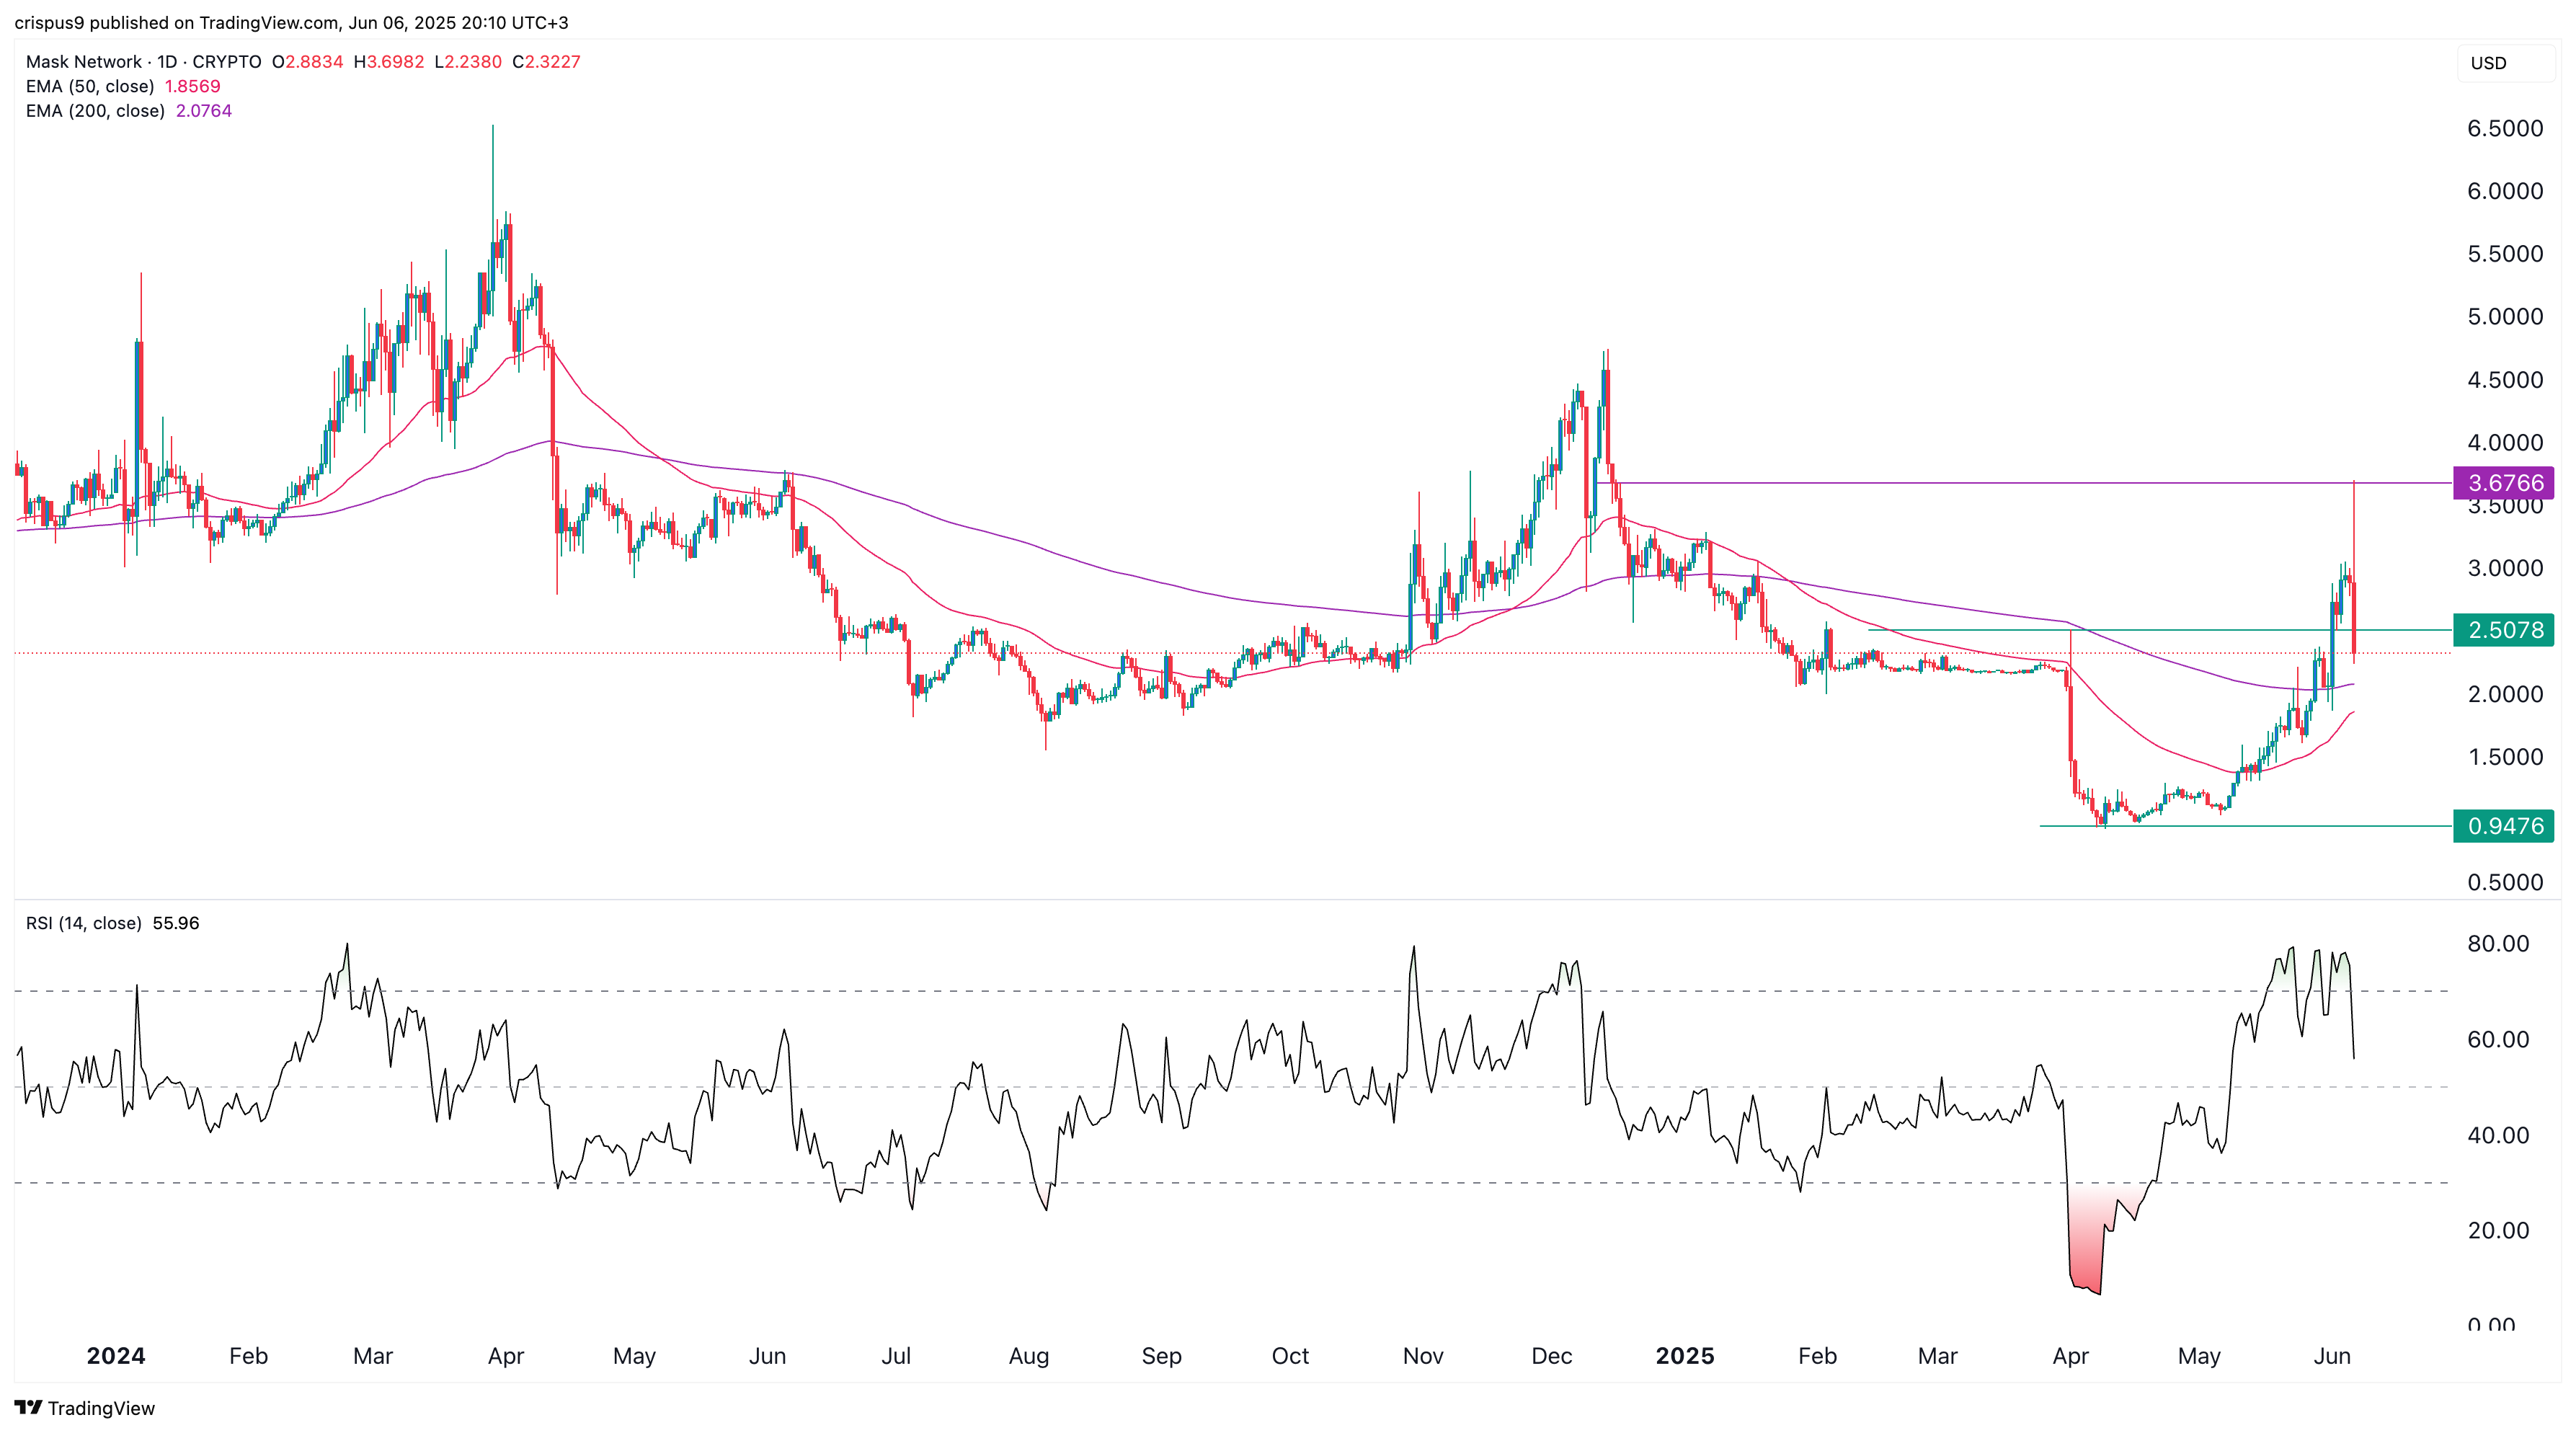
The daily chart shows that the MASK price surged to a high of $3.7020 and then suffered a harsh reversal to $2.3300. It dropped below the key support at $2.50, the highest swing on April 1.
The Relative Strength Index tilted downwards, moving from a high of 80 to 54. Therefore, the token will likely continue falling as sellers attempt to move below $2 and the 50-day and 200-day moving averages. Sustained selling may see it drop to $0.9475, the lowest point in April.
Disclaimer: The content of this article solely reflects the author's opinion and does not represent the platform in any capacity. This article is not intended to serve as a reference for making investment decisions.
You may also like
Ethereum: Bitmine Purchases 53,501 More ETH After Selling 131 Million Dollars

Sovereign bond yields hit highest since 2008! US and Japanese government bonds break key levels, why is the global bond market collapsing across the board?
The yield on 10-year US Treasury bonds has surged past 4.78%, approaching the 5% threshold, while the yield on 10-year Japanese bonds has touched 3% for the first time in 30 years. The simultaneous breakout of these two global benchmark sovereign bonds reflects concentrated macroeconomic pressures: Middle East conflicts have pushed oil prices back up to $90, Federal Reserve Chair Powell's hawkish stance has suppressed expectations for interest rate cuts, and a record-high $40 trillion US debt supply and the Bank of Japan's imminent tightening have together created extreme liquidity squeezes on both the supply and demand sides globally.
Solana falls 8.3% as whale wallets and ETF inflows reach new highs
Euro edges lower against British Pound as Germany’s Retail Sales fall more than expected in July
Crypto prices
More


