

Date: Tue, Aug 26, 2025 | 11:32 AM GMT
The cryptocurrency market is facing a sharp decline as Bitcoin (BTC) has retraced to $110K from its recent high of $117K, while Ethereum (ETH) has dipped 3% today to $4,425, adding downside pressure on major altcoins , including Hedera (HBAR).
HBAR is currently trading in the red, approaching a key support area that could dictate its next move.
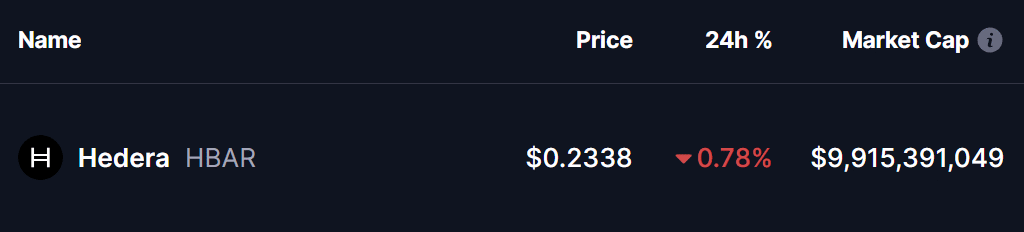 Source: Coinmarketcap
Descending Triangle in Play
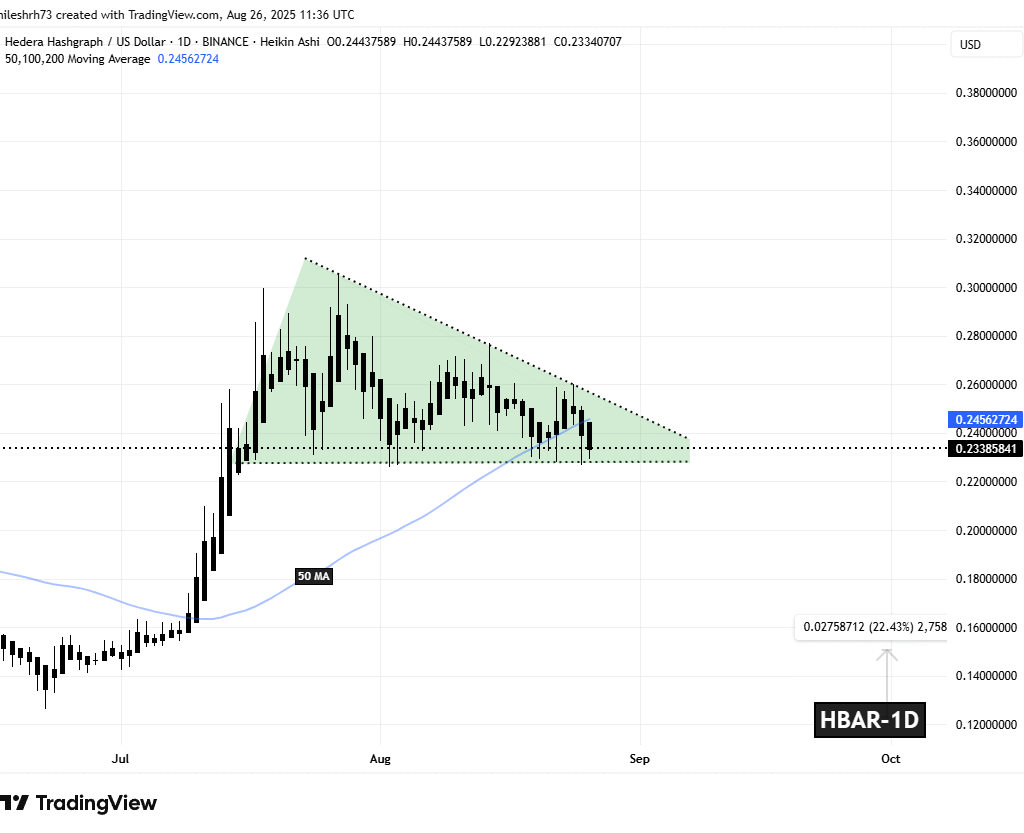
On the daily chart, HBAR has been consolidating inside a descending triangle pattern — a formation that is typically viewed as a bearish continuation structure, where lower highs tighten against a flat support base until a decisive move occurs.
So far, HBAR has managed to defend support around $0.2260, despite several retests. Each dip toward this zone has been met with steady buying, suggesting accumulation by strong hands. Currently, HBAR trades at $0.2341, just below the 50-day moving average at $0.245 and its descending trendline resistance.
 Hedera (HBAR) Daily Chart/Coinsprobe (Source: Tradingview)
This setup places HBAR right at the apex of the triangle, where a decisive move — either up or down — is increasingly likely.
What’s Next for HBAR?
If bulls succeed in breaking out above the 50-day MA and descending trendline, momentum could accelerate toward $0.3052, marking a gain of nearly 30% from current levels. Such a breakout would signal strong reversal strength and could attract fresh buyers.
However, if $0.2259 support fails, the bearish triangle thesis would be confirmed. In that scenario, HBAR could decline toward $0.1466, based on the height of the pattern — a drop of more than 35%.


