
FLOKI Slips Under a 2022 to 2025 Base Line and Traders Watch This Price Level

- The chart shows FLOKI falling under a rising trend that held since 2022 and this move marks a clear loss of structure.
- The ATH line sits far above the current zone and the price now trades well below the key midrange area.
- Repeated touches on the baseline shaped the full trend and the latest break signals a major structural turn.
FLOKI moved under a long rising trend line that has guided price since 2022 as the chart recorded a clear break under the base. The move placed the market under a wide support zone that held for several years. The price now sits below this level and forms a new pattern that traders monitor closely.
Break Below a Multi-Year Trend Line
The chart displays a rising line that began in 2022. This line connected several higher lows across three years of price action. Arrows mark each touch that confirmed the structure and shaped the full trend.
$FLOKI pic.twitter.com/Y1mzpJwrJs
— Cryptollica⚡️ (@Cryptollica) November 21, 2025
The line held through 2023 and 2024 with repeated rebounds. Each rebound created a stepping rise that kept the price above the long trend. The last major rebound formed early in 2025 and kept the trend active.
The new break moved the price under the line with firm distance. This move placed the price under the trend for the first time since the line formed. The loss of this long-range guide forms the key point shown on the chart.
Large Range Between Support and ATH
The chart shows a wide upper line marked ATH. This line sits far above the current zone. FLOKI reached that level during an earlier peak cycle and has never returned to that range.
Between the ATH line and the long trend line sits a wide horizontal band. This band acted as support and held price through several phases during 2023 and 2024. Price stayed inside this band for a long period before the new decline.
The recent fall moved the price under both the trend line and the support band. This forms a clear shift in structure. The chart also shows a dotted level near the mid-range, which now sits above the market.
Key Levels Visible in the Latest Move
The chart highlights price support near the rising line. This zone was held several times when arrows marked the rebounds. These touches show how the market reacted to rising support for more than three years.
The newest move shows the price falling below that same structure. A long wick from the recent candle stretches downward and suggests a wide intraday move. The market then settled under the trend and held that position.
A second rising line sits above the main trend. This line marks a projected long-term slope that the price has not yet tested. The current move remains below the trend yet above deeper long-term levels.
The pivotal question is whether the price will remain under the trend or return to the old support structure. The chart only shows technical levels, yet these levels define the market tone. The current position under the trend carries clear visual weight on the long-view chart.
The ATH line stays untouched in the current cycle. Price remains far under that level and trades in the lower zone of the full chart. This creates a wide gap between the present value and the extreme peak.
Disclaimer: The content of this article solely reflects the author's opinion and does not represent the platform in any capacity. This article is not intended to serve as a reference for making investment decisions.
You may also like
Michael Saylor’s Strategy Will Go Bankrupt This Cycle, Is There True Merit to This Statement?
Bitcoin Hyper Price Prediction as Tether Backs Anchorage and Deepsnitch AI Spot for 300x Rally

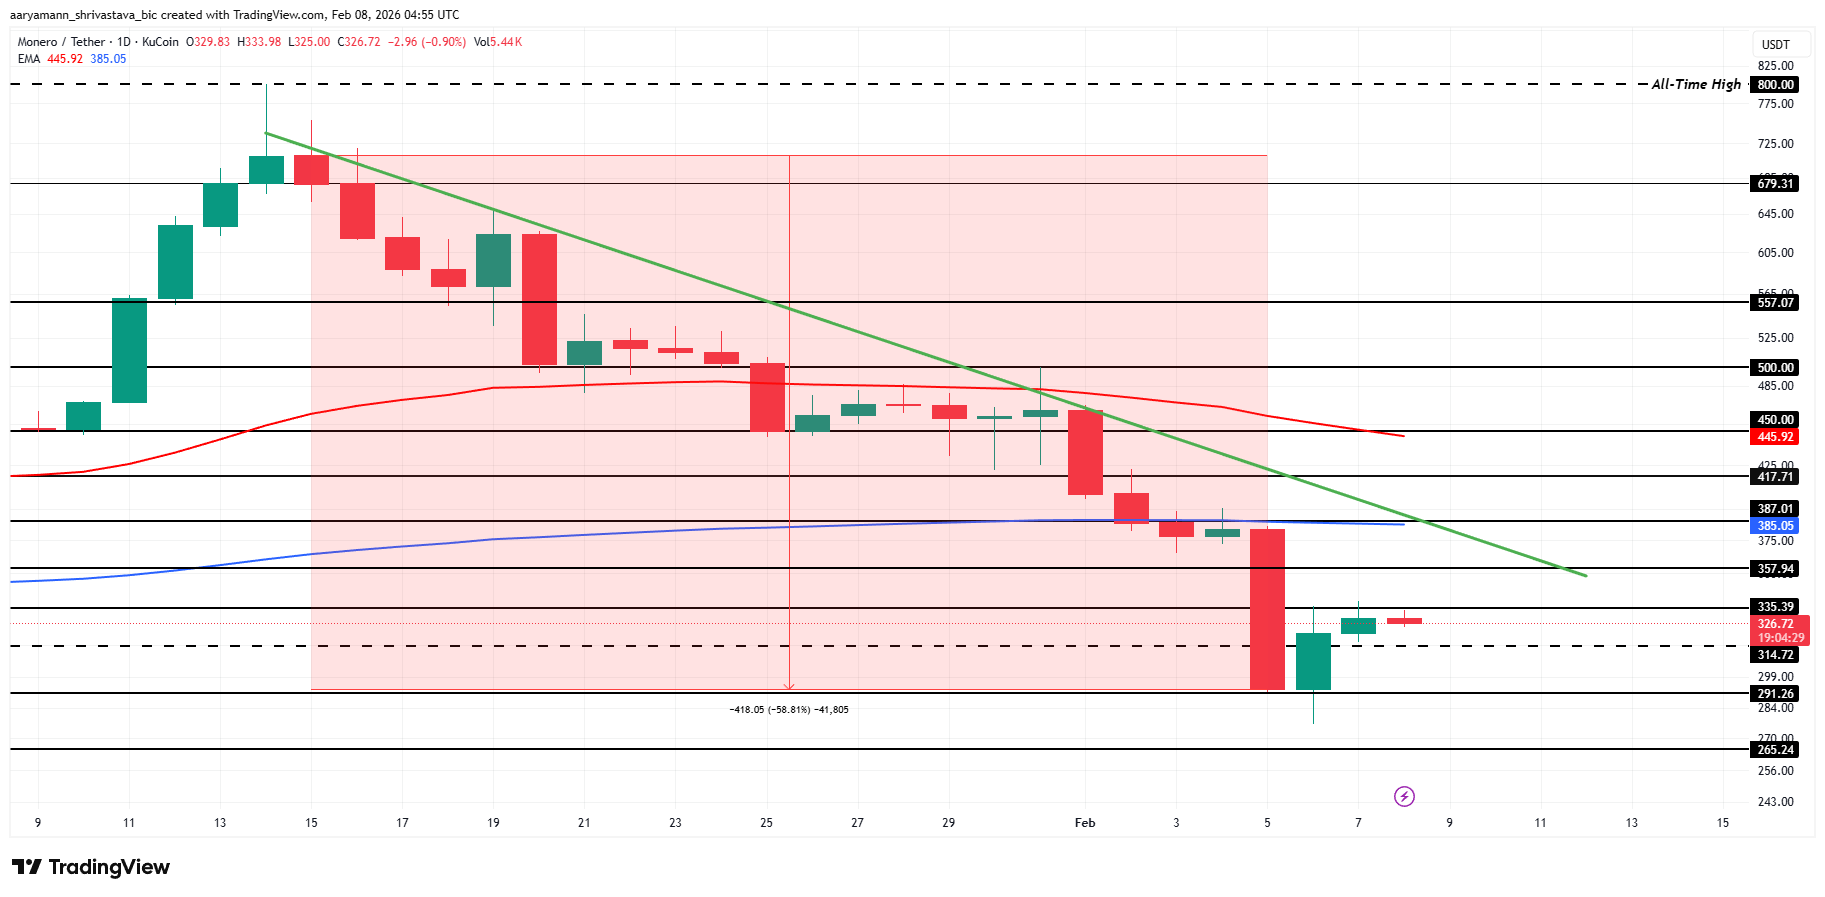
Monero XMR Attempts First Recovery in a Month, But Death Cross Risk Looms
Trending news
MoreMichael Saylor’s Strategy Will Go Bankrupt This Cycle, Is There True Merit to This Statement?
Meta’s extravagant Super Bowl commercials, costing millions, could be aimed at more than just promoting its smart glasses—they might also be intended to convince Wall Street of Zuckerberg’s vision for an AI-driven future