Key Takeaways
- Bitcoin is consolidating within a horizontal range after correcting from recent highs
- Current price structure closely mirrors a bullish fractal from late 2023
- RSI behavior suggests momentum may be rebuilding beneath the surface
- A breakout above the $98K level could confirm bullish continuation
The broader cryptocurrency market is trading in the green, with Bitcoin (BTC) posting gains of above 2% ahead of today’s highly anticipated FOMC decision scheduled for 2:00 PM ET. Market participants widely expect the Federal Reserve to hold the federal funds rate steady within the 3.5%–3.75% range, continuing its pause following rate cuts implemented in 2025.
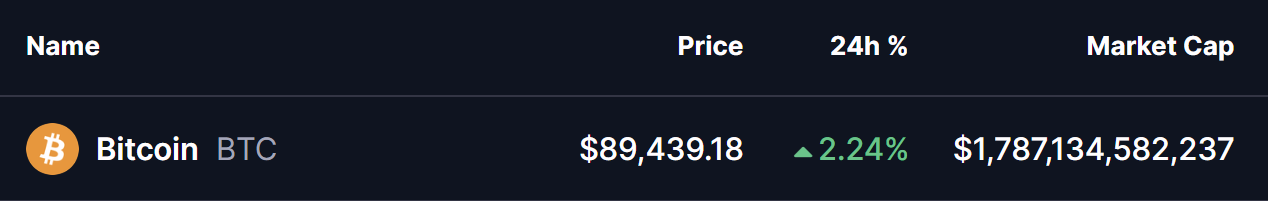 Source: Coinmarketcap
Beyond short-term macro catalysts, Bitcoin’s price structure on the daily chart is drawing increasing attention. Current price behavior closely resembles a familiar setup from 2023-2024 — a period that ultimately preceded a powerful bullish continuation. This similarity has raised the possibility that the ongoing consolidation phase may be laying the groundwork for a trend reversal rather than signaling further downside.
$BTC Mirrors a Previous Bullish Fractal
A fractal comparison shared by crypto analyst Javon Marks highlights a striking resemblance between Bitcoin’s current market structure and its price action during 2023-2024.
During that earlier phase, BTC rallied aggressively, faced a temporary rejection near resistance, and then entered a well-defined consolidation zone. That period of sideways movement formed a symmetrical structure, allowing momentum indicators like RSI to reset. Once the consolidation resolved, Bitcoin broke out decisively, triggering another leg higher toward fresh all-time highs.
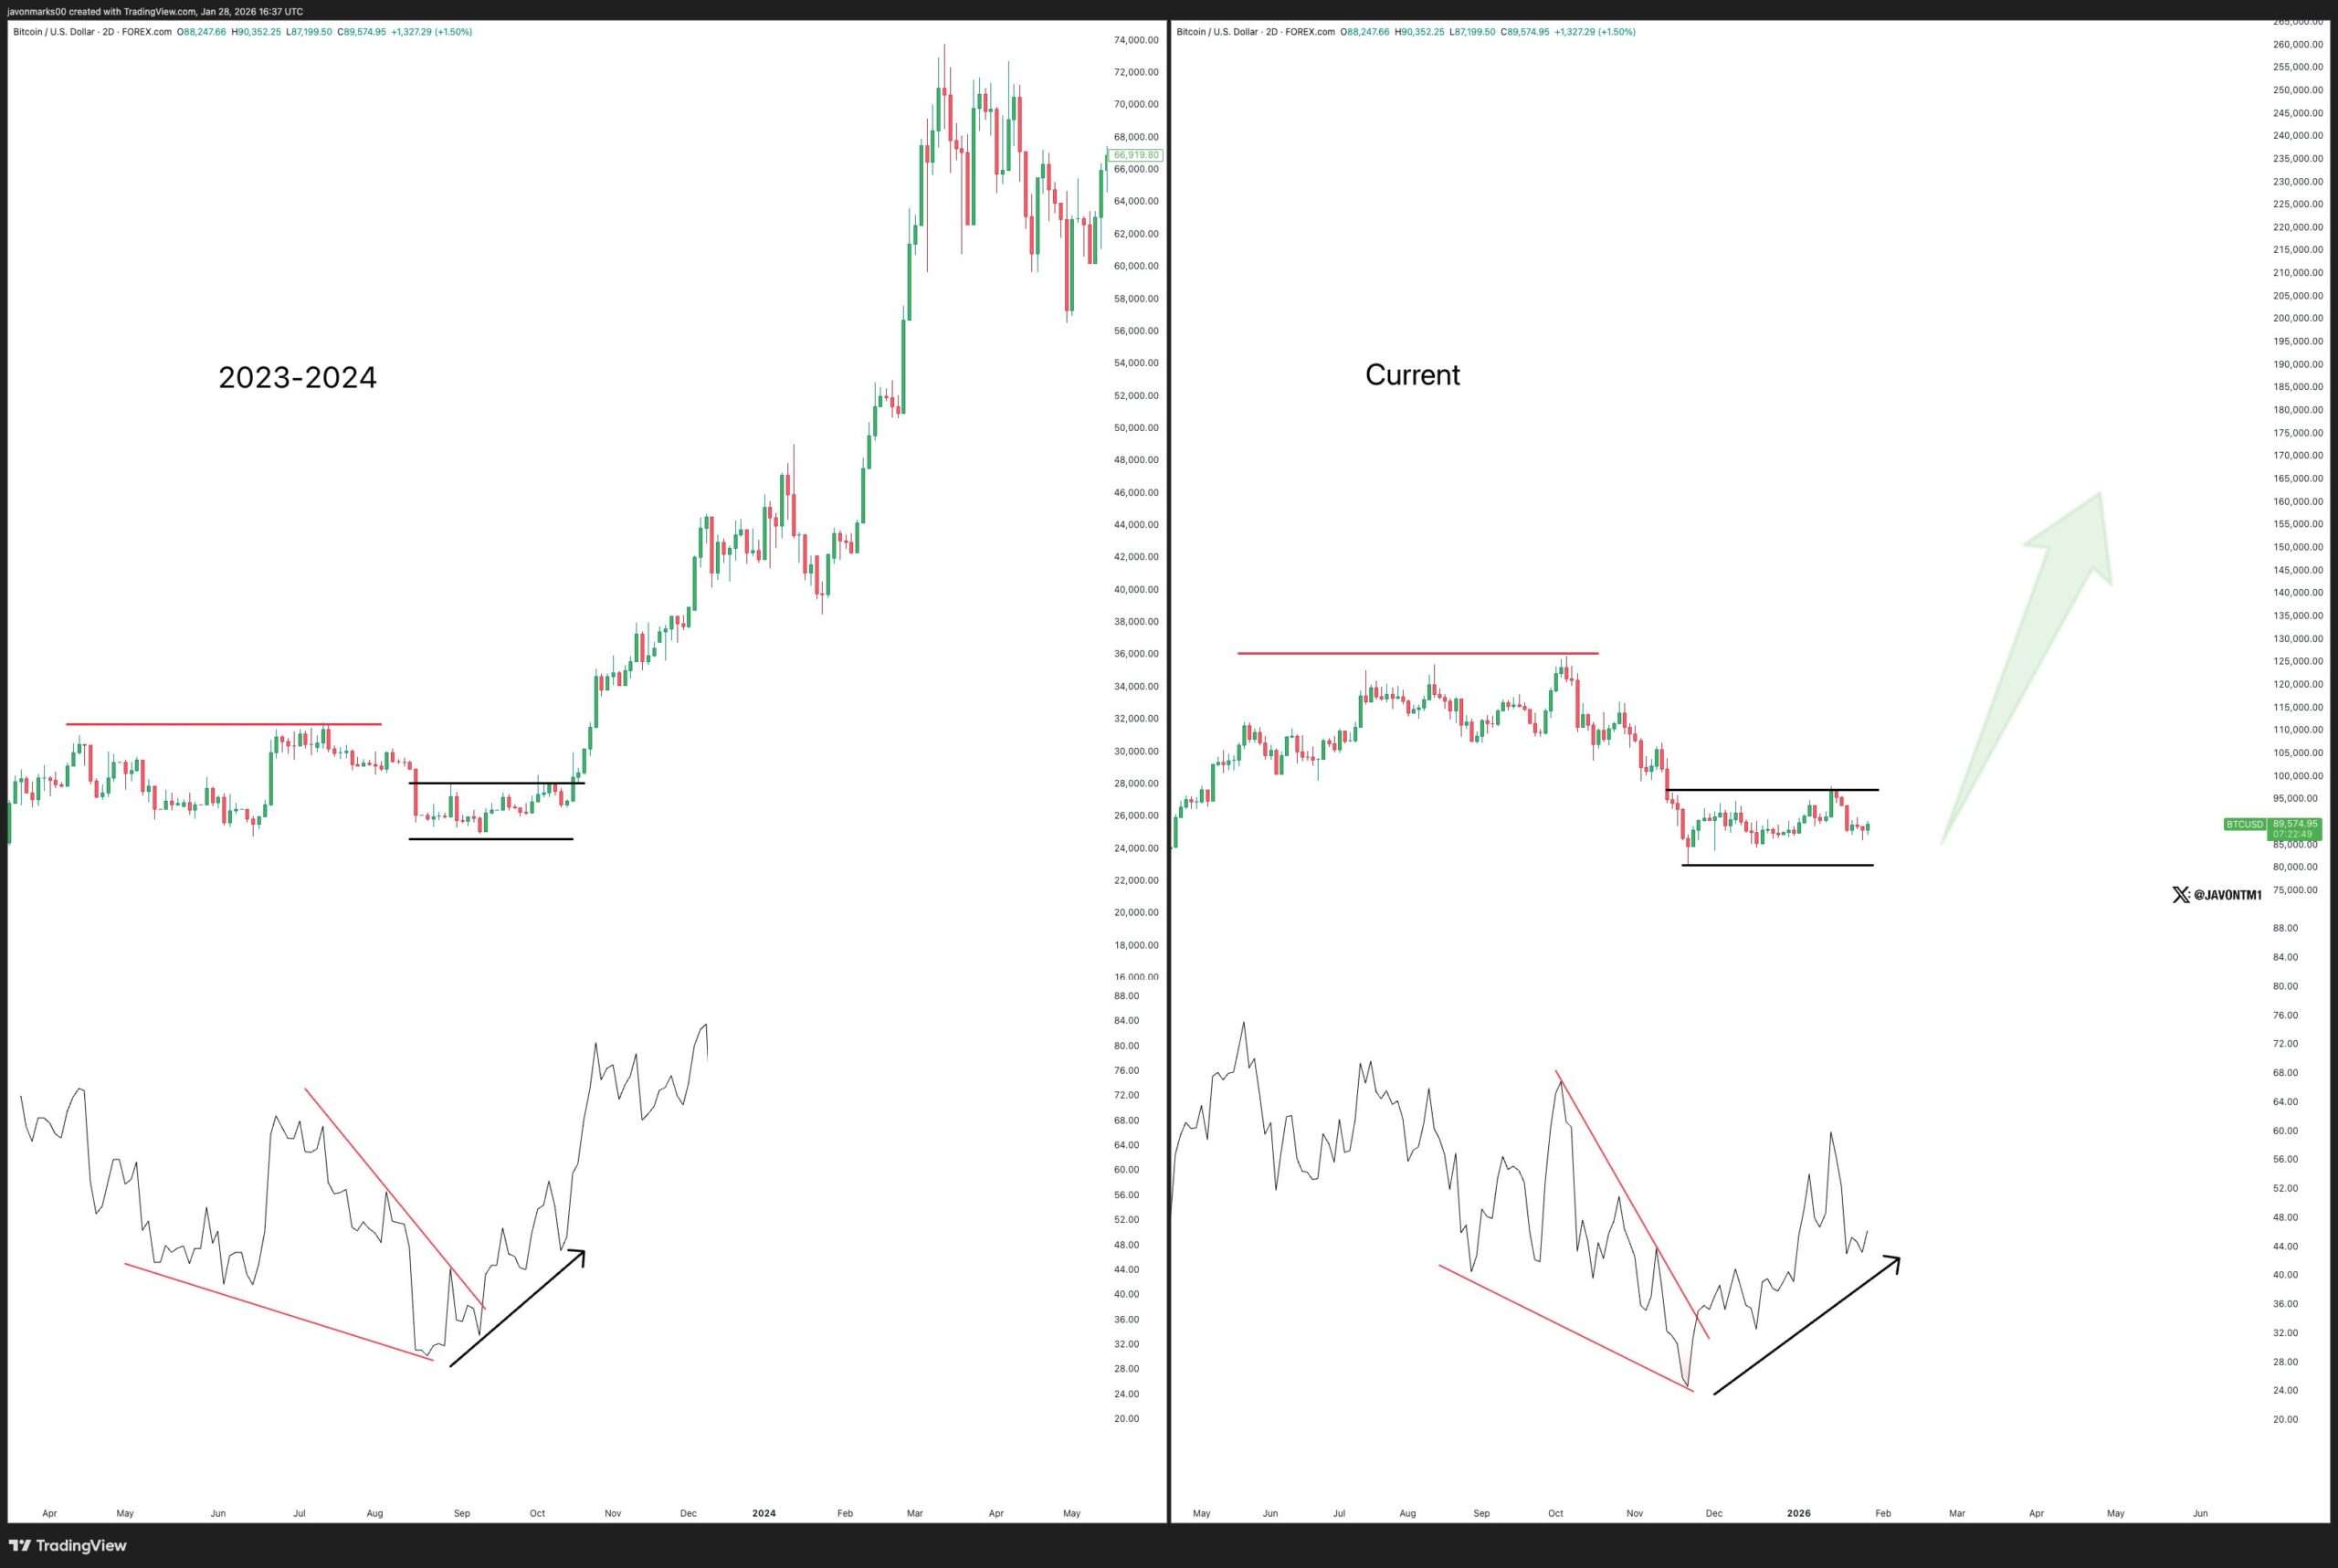 BTC Fractal Setup/Credits: @JavonTM1 (X)
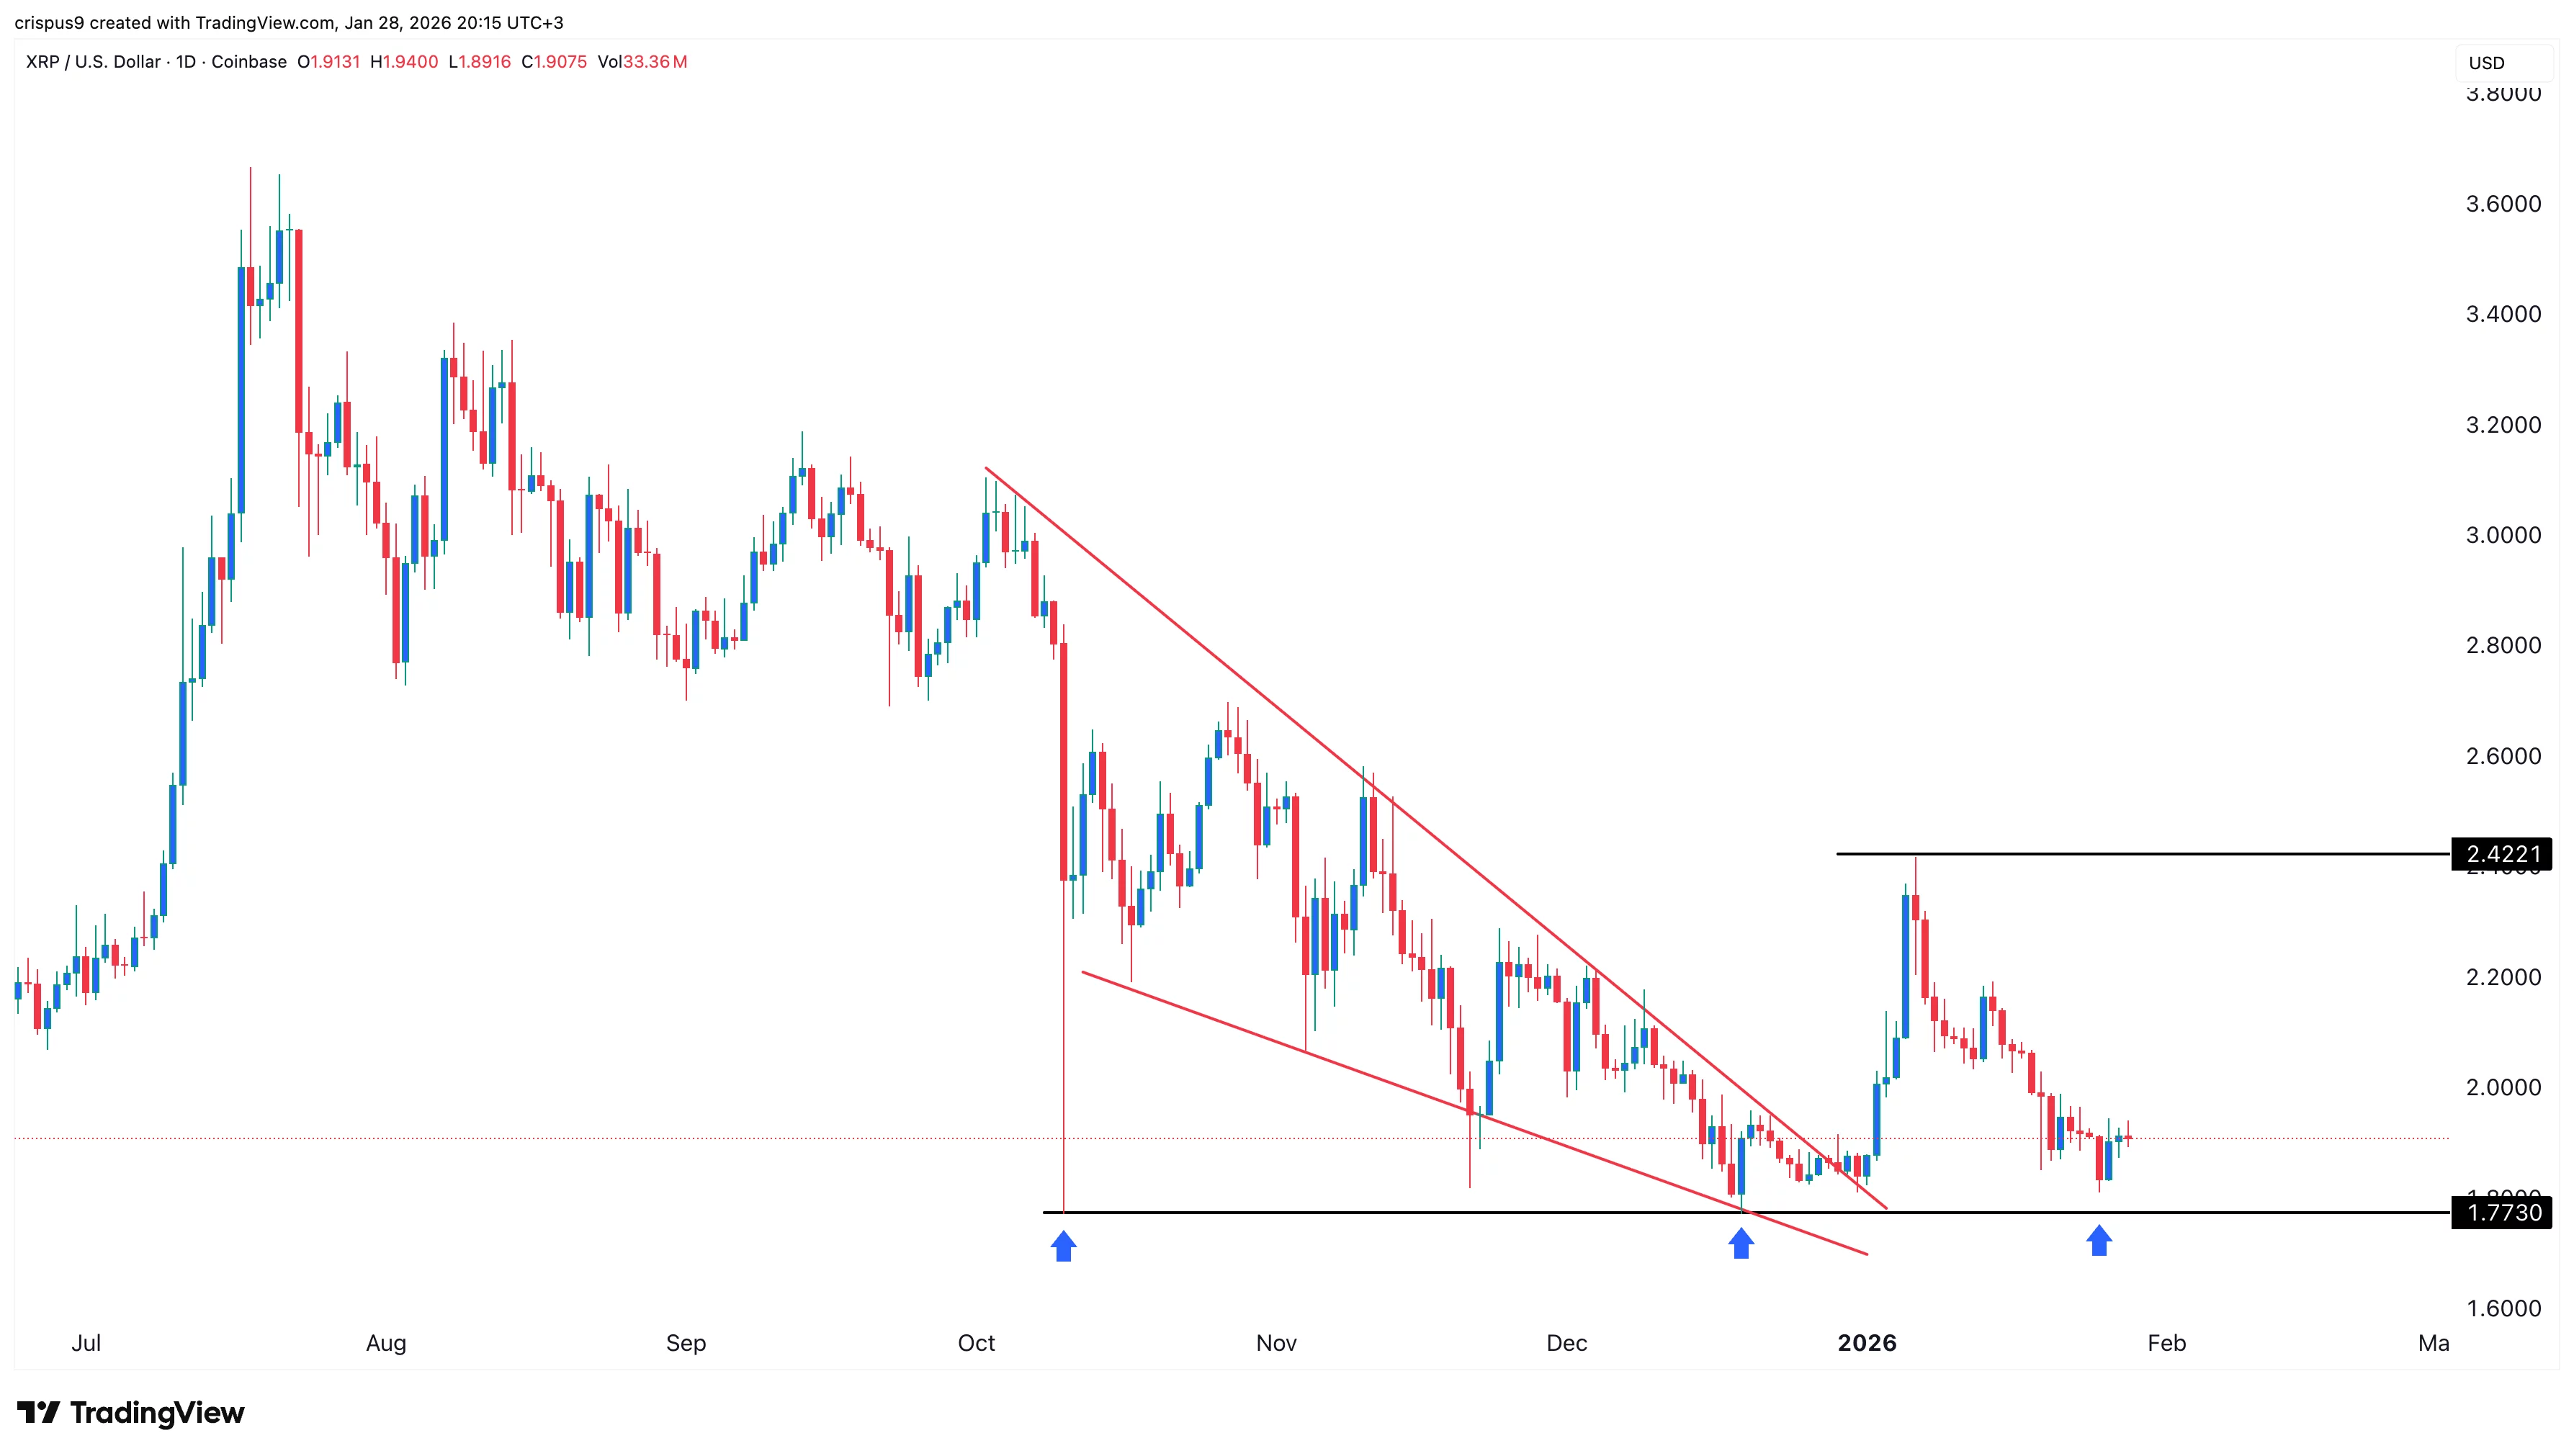
Fast forward to today, Bitcoin appears to be following a similar script. After correcting from its recent all-time high near $126,000 down to the $80,000 region, BTC has stabilized and begun trading within a horizontal consolidation range between $80K-$98K.
Price action is now marked by higher lows and controlled pullbacks, mirroring the structure seen prior to the 2023 breakout. Importantly, RSI behavior is also aligning with that historical fractal, suggesting momentum may be rebuilding beneath the surface.
What’s Next for BTC?
The convergence of a horizontal consolidation pattern and RSI symmetry points to a potentially constructive phase for Bitcoin. Historically, such setups have acted as continuation bases rather than distribution zones, especially when they form after strong impulsive moves.
If BTC can achieve a decisive breakout above the upper boundary of the range, particularly with a sustained move above the $98,000 resistance level, it would lend strong confirmation to the bullish fractal thesis. Such a breakout could open the door for renewed upside momentum and a potential push toward new all-time highs.
That said, short-term volatility remains likely, especially around macro-driven events like the FOMC decision. Periods of consolidation within the current range should not be ruled out. However, as long as price continues to hold above key support and on-chain data suggests ongoing accumulation by larger players, the broader trend bias remains tilted to the upside.
About Author: Nilesh Hembade is the Founder and Lead Author of Coinsprobe, with over 5 years of experience in the cryptocurrency and blockchain industry. Since launching Coinsprobe in 2023, he has been providing daily, research-driven insights through in-depth market analysis, on-chain data, and technical research.