
XRP price today trades near $1.73 after breaking below the $1.80 support level that has anchored price action since early January. The move follows a record single day ETF outflow and persistent spot selling, placing the token at a critical long term trendline that has defined the 2025 structure.
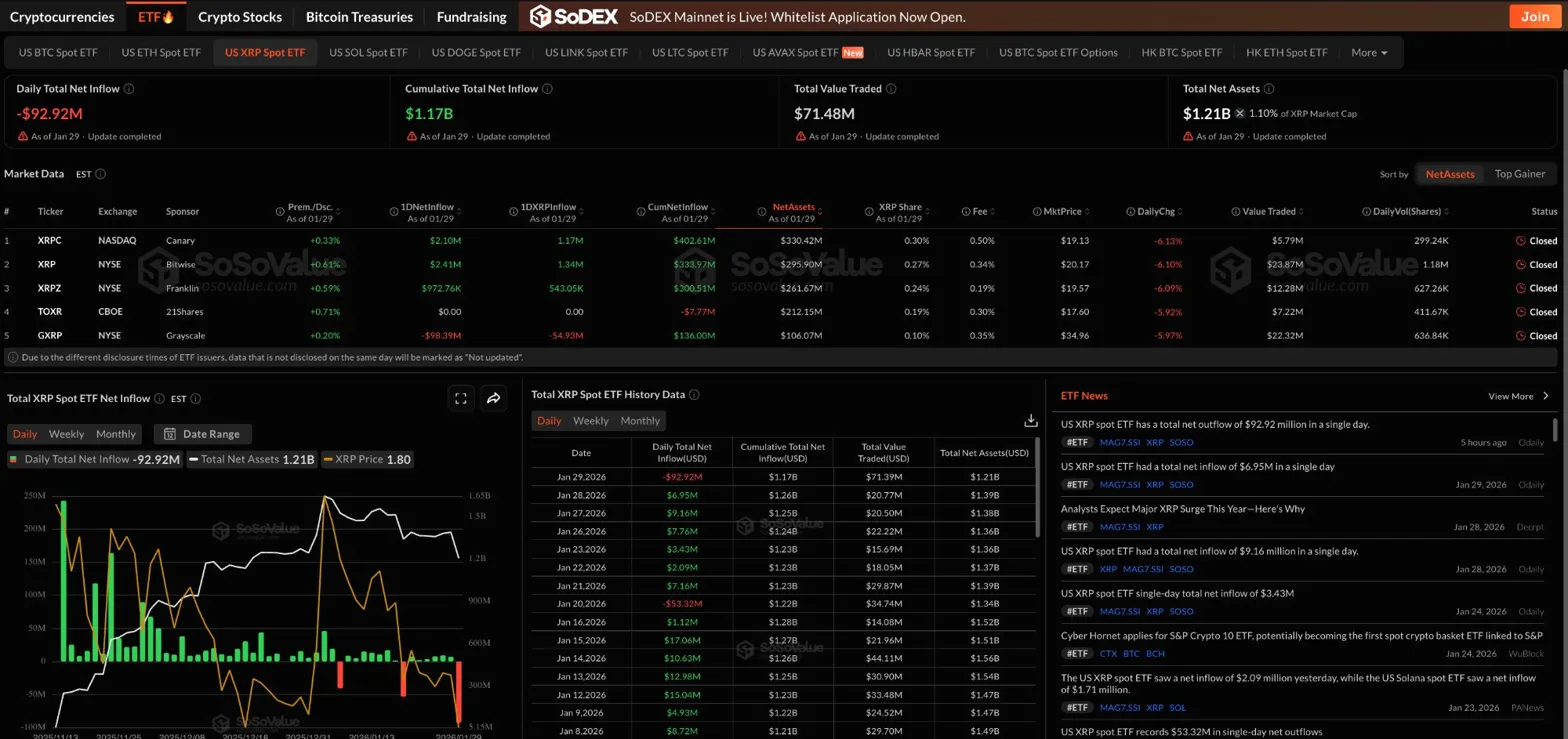
XRP ETFs recorded $92.92 million in net outflows on January 29, marking the largest single day redemption since these products launched. The Grayscale GXRP fund led the selling with $98.39 million in outflows, while Canary and Bitwise saw modest inflows of $2.10 million and $2.41 million respectively.
Total net assets across all XRP spot ETFs now stand at $1.21 billion, down from recent highs above $1.39 billion. Cumulative inflows remain at $1.17 billion, but the sharp reversal in daily flows signals that institutional holders are actively reducing exposure.
The timing aligns with broader altcoin weakness and a strong dollar environment that has pulled capital toward traditional safe havens. XRP ETFs had attracted consistent inflows through mid January, making this reversal particularly notable.
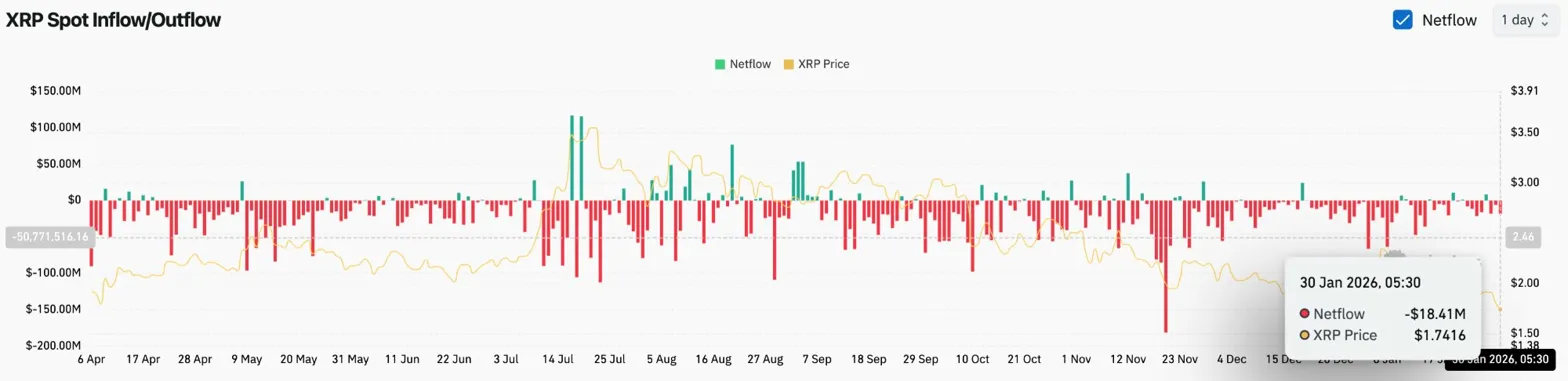
Coinglass data shows $18.41 million in spot outflows on January 30, extending a pattern of distribution that has persisted through the past week. The combination of ETF redemptions and spot selling creates a dual pressure that explains the accelerated breakdown below $1.80.
When both institutional and retail channels show net outflows simultaneously, price typically follows the direction of flows. Buyers have not stepped in to absorb the supply at current levels, leaving the market vulnerable to further downside.
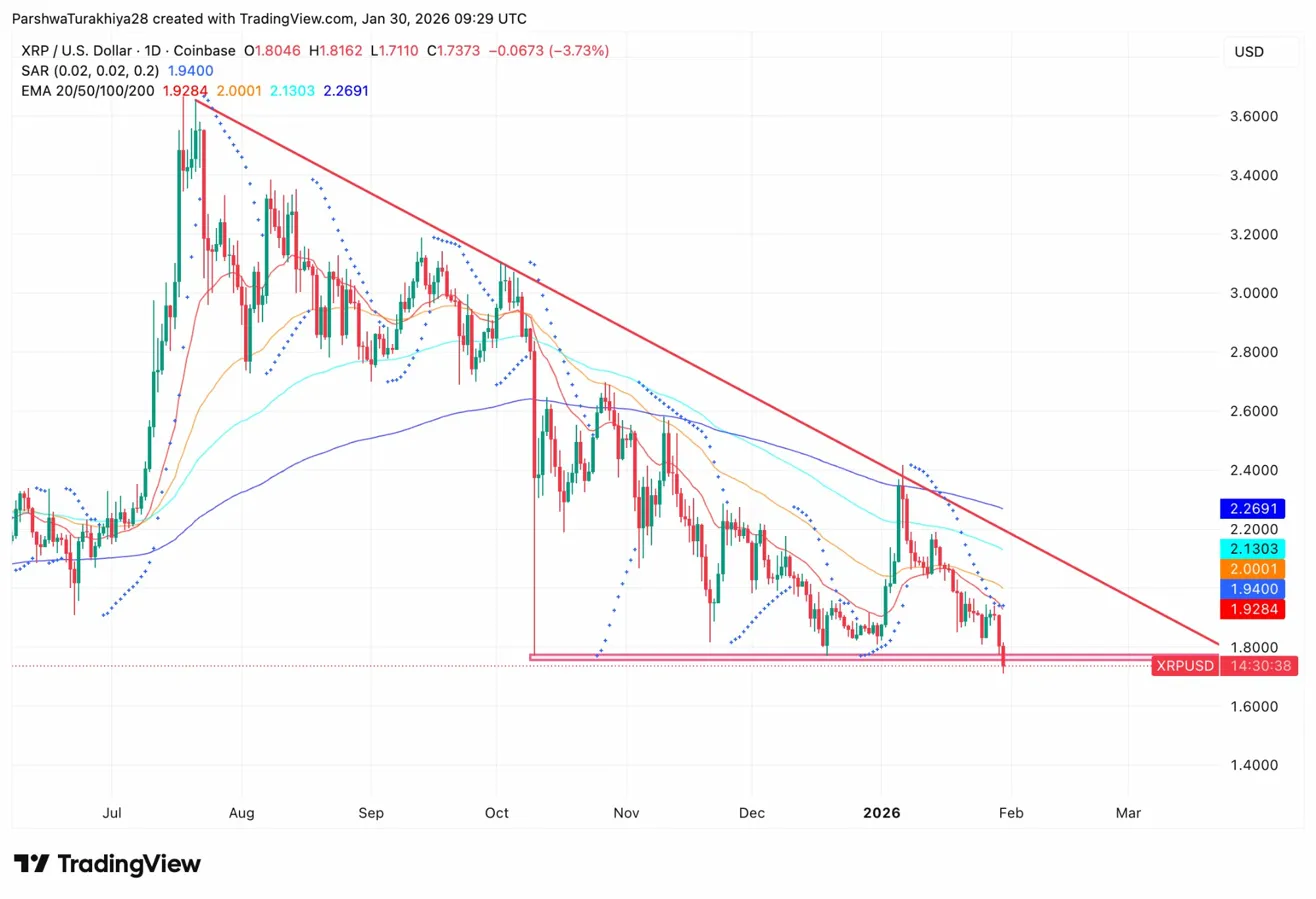
On the daily chart, XRP tests the ascending trendline drawn from the June 2025 lows. This trendline has supported price through multiple corrections, including the November pullback to $2.30 and the December retest near $1.80.
Price now trades below all four major EMAs. The 20 day EMA sits at $1.92, the 50 day at $2.00, the 100 day at $2.13, and the 200 day at $2.26. The Parabolic SAR remains bearish at $1.94, confirming the downtrend.
The descending trendline from the August highs near $3.60 continues to cap rallies, creating a narrowing wedge pattern. Price sits near the lower boundary of that wedge at $1.73, making this a pivotal level for the broader structure.
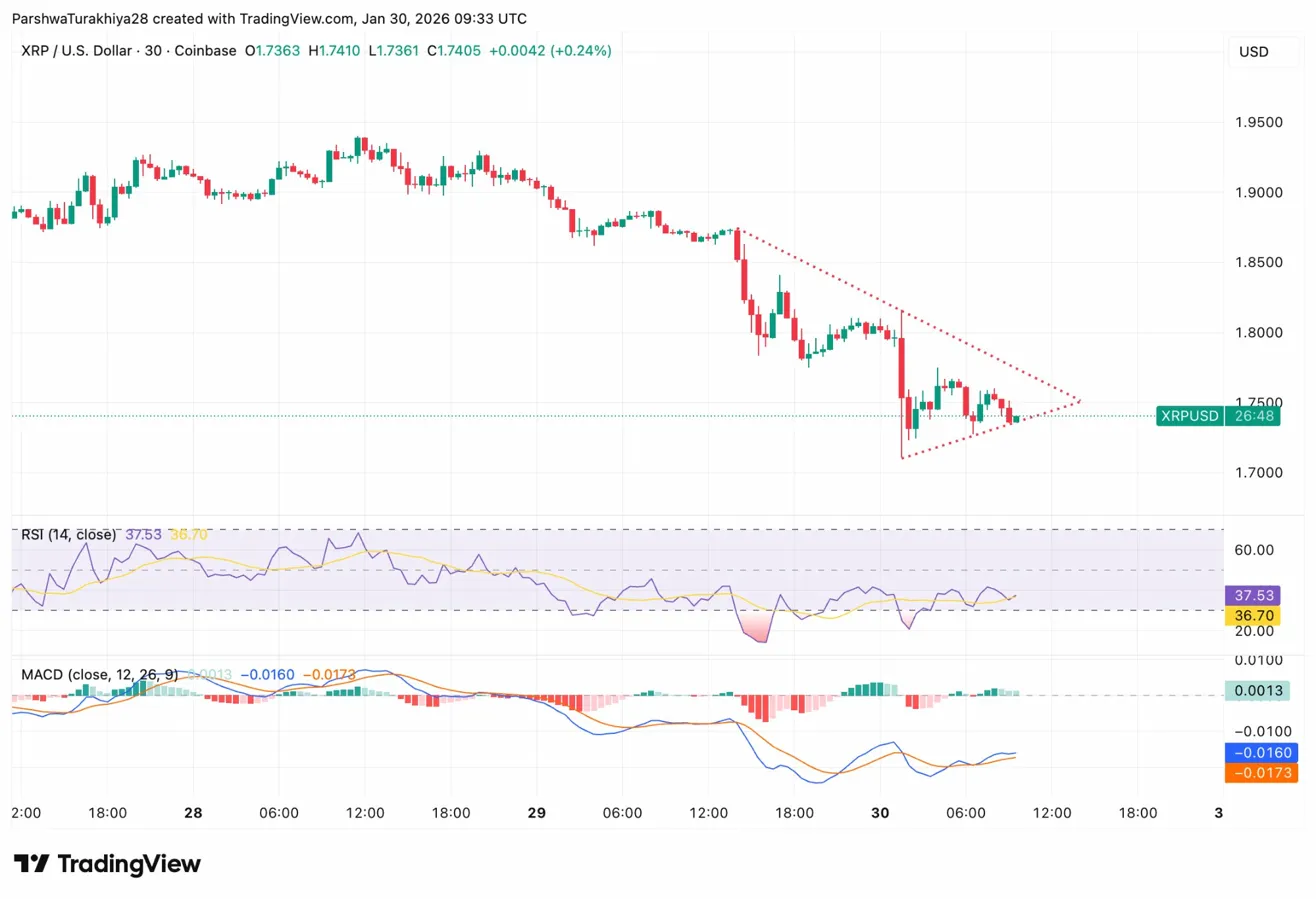
On the 30 minute chart, XRP shows a series of lower highs since January 28 when price traded above $1.95. The descending trendline has rejected every bounce attempt, with the latest rejection occurring near $1.81.
RSI sits at 37.53, recovering slightly from oversold levels reached during the session low at $1.71. MACD has turned positive on the histogram, suggesting the immediate selling pressure may be easing, but the signal remains weak.
The $1.71 low from January 30 marks immediate support. A break below that level would confirm a trendline breakdown and shift the structure from consolidation to continuation lower.
The trend remains bearish while price trades below the EMA cluster and ETF outflows persist.
- Bullish case: A daily close above $1.92 would reclaim the 20 day EMA and signal that the trendline is holding as support. That move would require a reversal in ETF flows and could target the $2.00 to $2.13 resistance zone.
- Bearish case: A close below $1.71 would confirm a breakdown of the long term ascending trendline and expose the $1.50 demand zone. With institutional selling accelerating, that scenario carries higher probability.
XRP needs a shift in ETF sentiment to stabilize. Until redemptions slow and spot flows improve, sellers control the tape.