
SUI Slides Into Key Fib Support — Is the Downtrend Far From Over?

By:Newsbtc
SUI is back under pressure after sliding into a key Fibonacci support zone, raising fresh concerns about whether the recent pullback is only a pause or the start of a deeper downside move. With bearish momentum still in play and no clear reversal signal yet, the market is now at a critical decision point that could shape SUI’s next major move.
Fibonacci Support Comes Into Focus
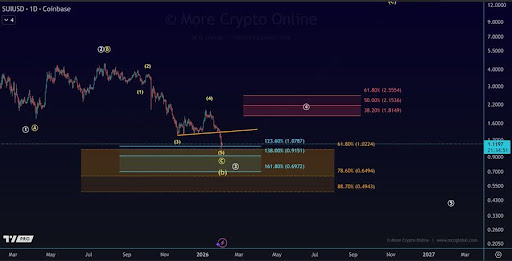
Crypto analyst More Crypto Online, in a recent update, revealed that SUI has now reached its next Fibonacci-based support levels, bringing key downside zones into focus. The 61.8% retracement sits near $1.20, while a broader support region extends between $0.91 and $1.70. These areas are defined using different analytical methods, with the orange zone representing retracement-based support and the blue zone derived from a measured comparison between the initial A-wave decline bottoming in April last year and the current C-wave.

From a structural perspective, SUI continues to display relative weakness when compared to Bitcoin, Ethereum, and Solana, all of which remain above their April 2025 lows. SUI has already broken below that level, reinforcing the view that downside pressure remains dominant.
var rnd = window.rnd || Math.floor(Math.random()*10e6); var pid607465 = window.pid607465 || rnd; var plc607465 = window.plc607465 || 0; var abkw = window.abkw || ''; var absrc = 'https://servedbyadbutler.com/adserve/;ID=172179;size=0x0;setID=607465;type=js;sw='+screen.width+';sh='+screen.height+';spr='+window.devicePixelRatio+';kw='+abkw+';pid='+pid607465+';place='+(plc607465++)+';rnd='+rnd+';click=CLICK_MACRO_PLACEHOLDER'; document.write('
');
if (!window.AdButler){(function(){var s = document.createElement("script"); s.async = true; s.type = "text/javascript";s.src = "https://servedbyadbutler.com/app.js";var n = document.getElementsByTagName("script")[0]; n.parentNode.insertBefore(s, n);}());}
var AdButler = AdButler || {}; AdButler.ads = AdButler.ads || []; var abkw = window.abkw || ""; var plc366606 = window.plc366606 || 0; (function(){ var divs = document.querySelectorAll(".plc366606:not([id])"); var div = divs[divs.length-1]; div.id = "placement_366606_"+plc366606; AdButler.ads.push({handler: function(opt){ AdButler.register(172179, 366606, [728,90], "placement_366606_"+opt.place, opt); }, opt: { place: plc366606++, keywords: abkw, domain: "servedbyadbutler.com", click:"CLICK_MACRO_PLACEHOLDER" }}); })();
 SUI market setup pointing to a possible bounce | Source:
Chart from More Crypto Online on X
SUI market setup pointing to a possible bounce | Source:
Chart from More Crypto Online on X
According to the analysis, the breakdown aligns with either a fifth wave to the downside unfolding within circle wave C, or with price moving through circle wave 3 of a larger bearish sequence. At this stage, no technical signs confirm that a local bottom has formed.
Both the yellow and white scenarios outlined in the analysis continue to allow for further downside. As long as price action fails to show clear reversal signals, additional weakness cannot be ruled out.
White Scenario: SUI Third Wave Down Remains In Play
The analyst further highlighted that under the white scenario, the market is considered to be in a third wave to the downside within a broader bearish structure. In this case, circle wave 3 is expected to reach at least the $0.915 level and could extend even lower. The more directly price continues to decline, the greater the likelihood that this bearish interpretation remains in play.
var rnd = window.rnd || Math.floor(Math.random()*10e6); var pid607472 = window.pid607472 || rnd; var plc607472 = window.plc607472 || 0; var abkw = window.abkw || ''; var absrc = 'https://servedbyadbutler.com/adserve/;ID=172179;size=0x0;setID=607472;type=js;sw='+screen.width+';sh='+screen.height+';spr='+window.devicePixelRatio+';kw='+abkw+';pid='+pid607472+';place='+(plc607472++)+';rnd='+rnd+';click=CLICK_MACRO_PLACEHOLDER'; document.write('
');
if (!window.AdButler){(function(){var s = document.createElement("script"); s.async = true; s.type = "text/javascript";s.src = "https://servedbyadbutler.com/app.js";var n = document.getElementsByTagName("script")[0]; n.parentNode.insertBefore(s, n);}());}
var AdButler = AdButler || {}; AdButler.ads = AdButler.ads || []; var abkw = window.abkw || ""; var plc452518 = window.plc452518 || 0; (function(){ var divs = document.querySelectorAll(".plc452518:not([id])"); var div = divs[divs.length-1]; div.id = "placement_452518_"+plc452518; AdButler.ads.push({handler: function(opt){ AdButler.register(172179, 452518, [728,90], "placement_452518_"+opt.place, opt); }, opt: { place: plc452518++, keywords: abkw, domain: "servedbyadbutler.com", click:"CLICK_MACRO_PLACEHOLDER" }}); })();

In contrast, the yellow scenario still leaves room for a future recovery. This outlook allows for a rally that could lead to new highs as part of a broader C-wave advance. However, for this bullish case to gain credibility, the market would need to deliver a clear five-wave move to the upside.
Without such confirmation, any upward movement is more likely to develop as a corrective wave 4 within the white scenario rather than the start of a new impulsive rally. In that context, rebounds would be expected to face resistance, with the standard resistance zone currently defined between $1.81 and $2.55.
 SUI trading at $1.11 on the 1D chart | Source: SUIUSDT on
Tradingview.com
SUI trading at $1.11 on the 1D chart | Source: SUIUSDT on
Tradingview.com
var rnd = window.rnd || Math.floor(Math.random()*10e6); var pid607473 = window.pid607473 || rnd; var plc607473 = window.plc607473 || 0; var abkw = window.abkw || ''; var absrc = 'https://servedbyadbutler.com/adserve/;ID=172179;size=0x0;setID=607473;type=js;sw='+screen.width+';sh='+screen.height+';spr='+window.devicePixelRatio+';kw='+abkw+';pid='+pid607473+';place='+(plc607473++)+';rnd='+rnd+';click=CLICK_MACRO_PLACEHOLDER'; document.write('
');
if (!window.AdButler){(function(){var s = document.createElement("script"); s.async = true; s.type = "text/javascript";s.src = 'https://servedbyadbutler.com/app.js';var n = document.getElementsByTagName("script")[0]; n.parentNode.insertBefore(s, n);}());}
var AdButler = AdButler || {}; AdButler.ads = AdButler.ads || []; var abkw = window.abkw || ''; var plc452519 = window.plc452519 || 0; (function(){ var divs = document.querySelectorAll(".plc452519:not([id])"); var div = divs[divs.length-1]; div.id = "placement_452519_"+plc452519; AdButler.ads.push({handler: function(opt){ AdButler.register(172179, 452519, [728,90], 'placement_452519_'+opt.place, opt); }, opt: { place: plc452519++, keywords: abkw, domain: 'servedbyadbutler.com', click:'CLICK_MACRO_PLACEHOLDER' }}); })();
0
0
Disclaimer: The content of this article solely reflects the author's opinion and does not represent the platform in any capacity. This article is not intended to serve as a reference for making investment decisions.
PoolX: Earn new token airdrops
Lock your assets and earn 10%+ APR
Lock now!
You may also like
今買うべき仮想通貨は?2026年を見据えてBitcoin Hyperが注目される理由
Newsbtc•2026/02/03 14:30
Ethereum Price Drop: Ether.fi CEO Reveals Why This Is Just Temporary Market Noise
Bitcoinworld•2026/02/03 14:27
Tensión por data inflacionaria ensombrece coyuntura de plaza financiera argentina
101 finance•2026/02/03 14:27
Trending news
MoreCrypto prices
MoreBitcoin
BTC
$78,093.72
+0.15%
Ethereum
ETH
$2,300.22
-0.61%
Tether USDt
USDT
$0.9991
-0.00%
BNB
BNB
$773
+1.09%
XRP
XRP
$1.61
-1.17%
USDC
USDC
$0.9998
+0.00%
Solana
SOL
$102.84
-0.23%
TRON
TRX
$0.2829
+0.20%
Dogecoin
DOGE
$0.1077
+1.44%
Hyperliquid
HYPE
$35.72
+12.74%
How to buy BTC
Bitget lists BTC – Buy or sell BTC quickly on Bitget!
Trade now
Become a trader now?A welcome pack worth 6200 USDT for new users!
Sign up now