
Previewing Retail Sector Earnings: A Closer Look

Walmart WMT shares have been standout performers this year, handily outperforming not just the broader market indexes and brick-and-mortar retail peers but also Amazon AMZN and many members of the Magnificent 7 group.
With the company set to report quarterly results on Thursday, February 19th, it will be interesting to see whether the stock can maintain its momentum after the results.
The chart below shows the year-to-date performance of Walmart shares (green line, up +20.2%) relative to the Mag 7 group (blue line, down -5.4%), the S&P 500 index (red line, down -0.4%), Amazon (purple line, down -13.9%) and Target shares (orange line in the chart, up +18.2%). Target has also been added to the chart, though the company will be reporting quarterly results on Tuesday, March 3
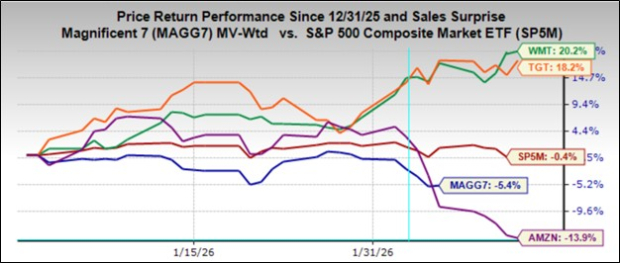
Image Source: Zacks Investment Research
We should keep in mind, however, that the performance pecking order shifts when we move the starting point of this chart back by 12 months, as shown below. Target has enjoyed an impressive run this year, but the retailer’s one-year performance is comparable to Amazon’s.
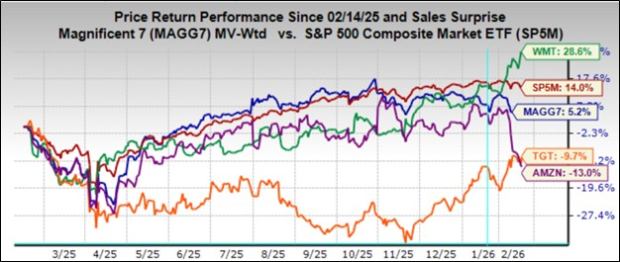
Image Source: Zacks Investment Research
Walmart’s share price outperformance reflects the market’s collective optimism about the company’s large and growing digital business, which has enabled it to tap new growth opportunities such as third-party fulfillment and advertising.
Walmart’s e-commerce business complements its core merchandise, which remains heavily indexed toward groceries, other essentials, and must-have necessities. This orientation towards essentials, coupled with Walmart’s well-earned reputation for low prices, provides the company’s results with a high degree of cyclical stability.
We should note, however, that a big contributing factor to Walmart’s stock market momentum over the last few years reflects its ability to gain market share among higher-income households. Driving those gains has been a combination of higher-income households trading down to Walmart in response to inflation and the ease of using the company’s e-commerce capabilities. Walmart has consistently flagged market-share gains across all income categories, particularly in the high-income category, and we expect further gains on that front in this quarterly report as well.
Results likely benefited from pulled-forward demand in anticipation of tariffs, particularly in some categories like electronics. Growth in e-commerce and steadily lower losses in that business, coupled with gains from third-party fulfillment and advertising, are some of the other areas that will benefit results this quarter.
The e-commerce business in the U.S. is now profitable and will likely become a significant contributor to earnings in 2026 and beyond. E-commerce accounts for an estimated 15% of total ex-gasoline sales at present, which management sees eventually increasing to more than double that level over time.
With respect to tariffs, management noted earlier in the year that roughly two-thirds of U.S. sales were from domestically sourced products, which gave them a degree of insulation from the tariffs issue compared to others. A big part of this is Walmart’s groceries business, which accounts for almost 60% of its sales, unlike Target, where groceries are a much smaller part of the revenue mix.
Management has reiterated its commitment to maintain price advantage over rivals, a function of Walmart’s size, the nature of its supplier relationships, and the increasing automation of its logistical operations. Walmart’s value orientation and well-executed digital strategy have been key to gaining grocery market share by attracting higher-income households.
Walmart is expected to report $0.73 in EPS on $189.9 billion in revenues, representing year-over-year changes of +10.6% and +5.2%, respectively. Estimates have been stable, though they have nudged up a hair since the quarter began.
In terms of same-store sales, the expectation is of U.S. comps (ex fuel) of +4.17%, which will compare to a +4.4% gain in the preceding quarter (vs. expectations of +4.02%), and a +4.9% gain in the year-earlier period (vs. expectations of +4.36%). A positive general merchandise read will also have positive read-throughs for Target.
With respect to the Retail sector 2025 Q4 earnings season scorecard, we now have results from 13 of the 31 retailers in the S&P 500 index. Regular readers know that Zacks has a dedicated stand-alone economic sector for the retail space, which is unlike the placement of the space in the Consumer Staples and Consumer Discretionary sectors in the Standard & Poor’s standard industry classification.
The Zacks Retail sector includes not only Walmart, Target, and other traditional retailers, but also online vendors like Amazon AMZN and restaurant players. The 13 Zacks Retail companies in the S&P 500 index that have already reported Q4 results belong mostly to the e-commerce and restaurant industries, though we have several restaurant companies on deck to report this week as well.
Total Q4 earnings for these 13 retailers that have reported are up +6.3% from the same period last year on +11.6% higher revenues, with 46.2% beating EPS estimates and 76.9% beating revenue estimates.
The comparison charts below put the Q4 beats percentages for these retailers in a historical context.
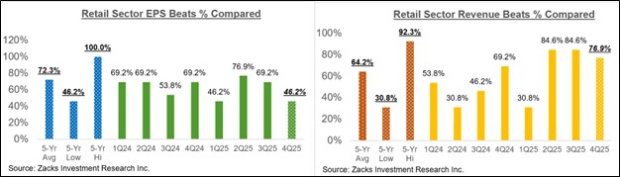
Image Source: Zacks Investment Research
As you can see above, the EPS beats percentages for these online players and restaurant operators are tracking significantly below the historical averages for this group of companies. In fact, the Q4 EPS beats percentage at 46.2% matches the lowest beats percentage for this group of Retail sector companies in the preceding 20-quarter period. Unlike EPS beats, revenue beats are far more numerous and tracking above historical averages.
With respect to the elevated earnings growth rate at this stage, we like to show the group’s performance with and without Amazon, whose results are among the 13 companies that have already reported. As we know, Amazon’s Q4 earnings were up +5.9% on +13.6% higher revenues, as it beat EPS and top-line expectations.
As we all know, digital and brick-and-mortar operators have been converging for some time, with Amazon now a decent-sized brick-and-mortar operator after Whole Foods and Walmart now a growing online vendor. As we noted in the context of discussing Walmart’s coming results, the retailer is steadily becoming a big advertising player, thanks to its growing digital business. This long-standing trend got a huge boost from the Covid lockdowns.
The two comparison charts below show the Q4 earnings and revenue growth relative to other recent periods, both with Amazon’s results (left side chart) and without Amazon’s numbers (right side chart).
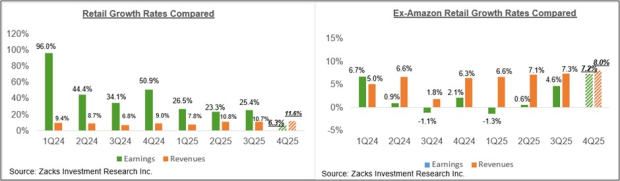
Image Source: Zacks Investment Research
Q4 Earnings Season Scorecard
Through Friday, February 13
We have more than 400 companies on deck to report results this week, including 56 index members. The week’s lineup includes a blend of operators such as Palo Alto Networks, DoorDash, Etsy, and Booking Holdings, as well as traditional bellwethers such as Toll Brothers, Deere, and others.
The comparison charts below put the growth rates for these 371 index members with what we had seen from this same group of companies in other recent periods.
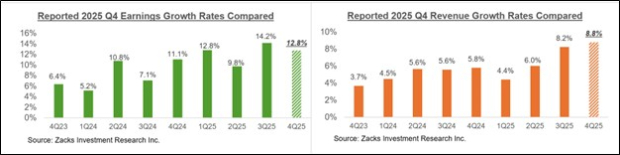
Image Source: Zacks Investment Research
The comparison charts below put the Q4 EPS and revenue beats percentages for this group companies relative to what we had seen from them in other recent periods.
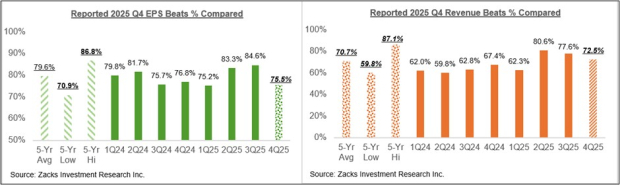
Image Source: Zacks Investment Research
The comparison chart below puts the Q4 net margins for the 371 companies that have reported in a historical context.
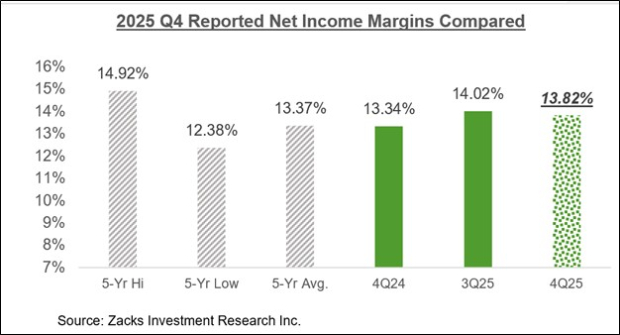
Image Source: Zacks Investment Research
The Earnings Big Picture
The chart below shows the Q4 earnings and revenue growth expectations in the context of where growth has been in the preceding four quarters and what is expected in the coming three quarters.
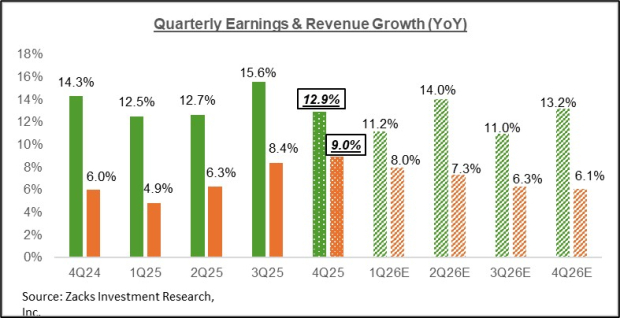
Image Source: Zacks Investment Research
Estimates for the current period (2026 Q1) have risen modestly in recent days, as the chart below shows.
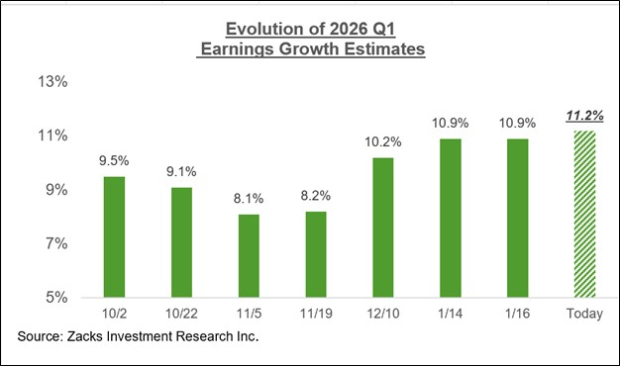
Image Source: Zacks Investment Research
2026 Q1 estimates have increased modestly for 5 of the 16 Zacks sectors since the start of January, including Tech, Industrials, Retail, Utilities, and Business Services. On the negative side, Q1 estimates have come down for 10 of the 16 Zacks sectors, with the biggest declines at the Energy, Medical, and Consumer Discretionary sectors.
The chart below shows the overall earnings picture on a calendar-year basis, with double-digit earnings growth expected in 2025 and 2026.
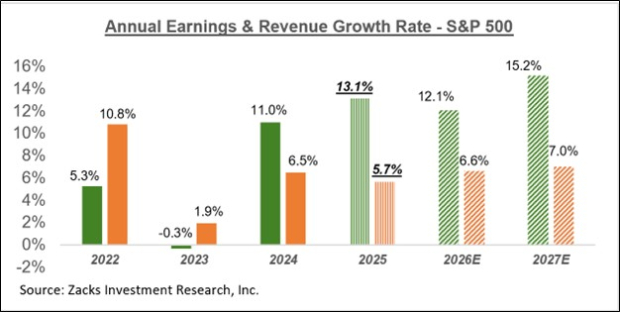
Image Source: Zacks Investment Research
Disclaimer: The content of this article solely reflects the author's opinion and does not represent the platform in any capacity. This article is not intended to serve as a reference for making investment decisions.
You may also like
Banks Urged to Embrace Patrick Witt Stablecoin Yield View
Rivian Automotive (RIVN) Climbs 26.6% on PT Hike

ICON PLC (ICON) Soars 16% as Analyst Issues 'Hold', $93 PT Despite Accounting Concerns

Shiba Inu's 140 Billion SHIB Exchange Outflow: Implications for Market Liquidity
