
Key Takeaways
- RENDER is forming a double bottom near $1.13, signaling fading selling pressure and a potential bullish reversal.
- A reclaim of the 50-day moving average around $1.69 could open the path toward the $2.62–$2.68 neckline.
- Bulls must defend $1.13 support — a breakdown below this level would invalidate the bullish setup.
RENDER, the native token of the Render Network — a decentralized platform focused on GPU computing — is starting to regain traction after weeks of heavy selling pressure. The token is up over 9% in the past seven days, hinting that buyers may finally be stepping back in.
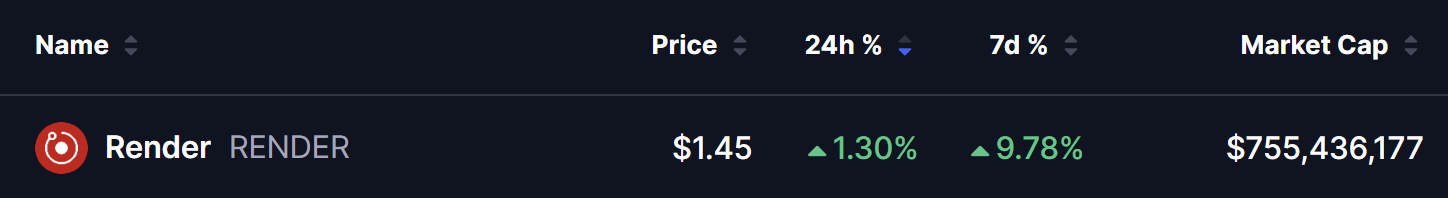 Source: Coinmarketcap
More importantly, RENDER’s daily chart is now flashing a classic bullish reversal setup, suggesting the recent downtrend could be losing steam.
Technical Patterns Hint at Upside Momentum
On the daily timeframe, RENDER appears to be forming a double bottom pattern, a well-known structure that often develops near the end of prolonged declines.
Here’s how the setup is unfolding on the chart:
- The first bottom formed as price dropped into the $1.13 support zone, followed by a sharp rebound.
- That bounce carried RENDER toward the neckline resistance around $2.68, where sellers stepped back in and rejected the move.
- Price then rolled over and returned to the same $1.13 area, but this time, buyers defended the level again — creating the second bottom.
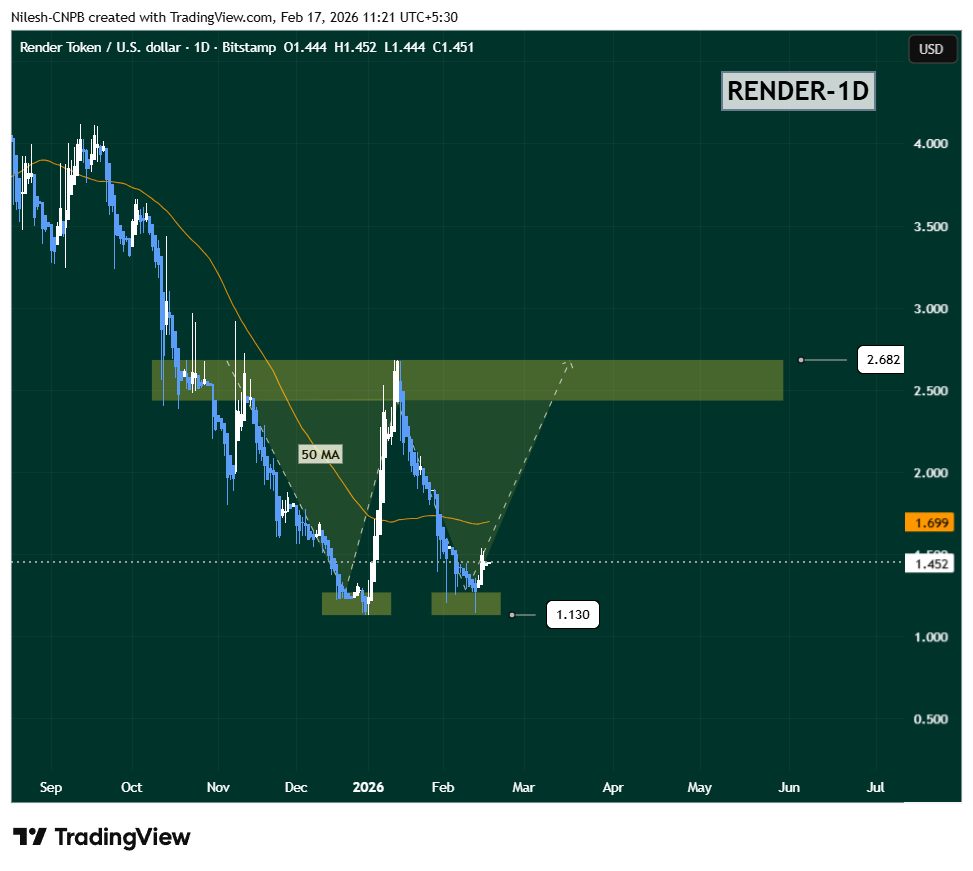 Render (RENDER) Daily Chart/Coinsprobe (Source: Tradingview)
This repeated defense of $1.13 is a key signal. It shows that selling pressure is weakening and demand is building at lower levels. RENDER is now trading around $1.45, indicating early stabilization after the retest.
Adding to this, price is currently attempting to base just below the 50-day moving average, a level that often acts as a momentum switch during trend transitions.
What’s Next for RENDER?
For this bullish structure to gain real credibility, RENDER needs to reclaim the 50-day moving average near $1.69. A sustained move above this level would mark a shift in short-term momentum and increase the odds of a recovery rally.
If buyers manage to push price back toward the $2.62–$2.68 neckline zone, that area will become the next major test. A clean breakout above this resistance — ideally followed by a successful retest — would confirm the double bottom pattern and could open the door for a stronger upside move in the weeks ahead.
On the downside, the $1.13 support zone remains the most critical level to watch. A breakdown below this area would invalidate the bullish setup and likely expose RENDER to another leg lower or extended consolidation.
About Author: Nilesh Hembade is the Founder and Lead Author of Coinsprobe, with over 5 years of experience in the cryptocurrency and blockchain industry. Since launching Coinsprobe in 2023, he has been providing daily, research-driven insights through in-depth market analysis, on-chain data, and technical research.