No one wants US Treasuries anymore? Can the US dollar hold up? How much higher can gold go as a safe haven this time?

Huitong Network, February 26 — This article will analyze the market trends for the next 2-3 trading days from two differentiated perspectives: the impact of changes in U.S. Treasury yields on the dollar, and the transmission mechanism of risk-averse sentiment in the bond market to the gold market.
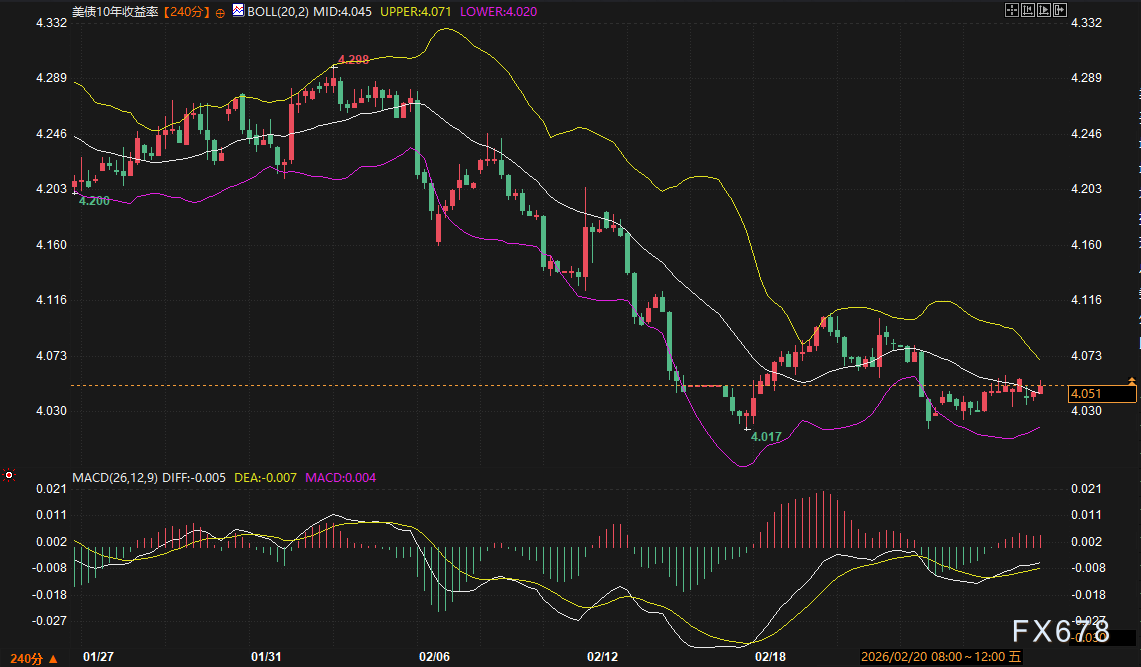
On Thursday (February 26), global financial markets continued their recent cautious tone. Although the U.S. Dollar Index rebounded slightly in the previous trading session, it failed to reverse the pressure trend seen so far this week; spot gold remained steady within a volatile range just below its historical high, indicating a subtle balance between bulls and bears. At the same time, the overall U.S. Treasury yield curve shifted downward, with the 10-year Treasury yield approaching the key technical level of 4.04%, becoming the core variable driving current market pricing. This article will project market trends for the next 2-3 trading days from two perspectives: the impact of changes in U.S. Treasury yields on the dollar, and the mechanism of risk aversion transmission from the bond market to the gold market.
U.S. Treasury Yield Curve Flattens, Dollar’s Upward Momentum Weakened
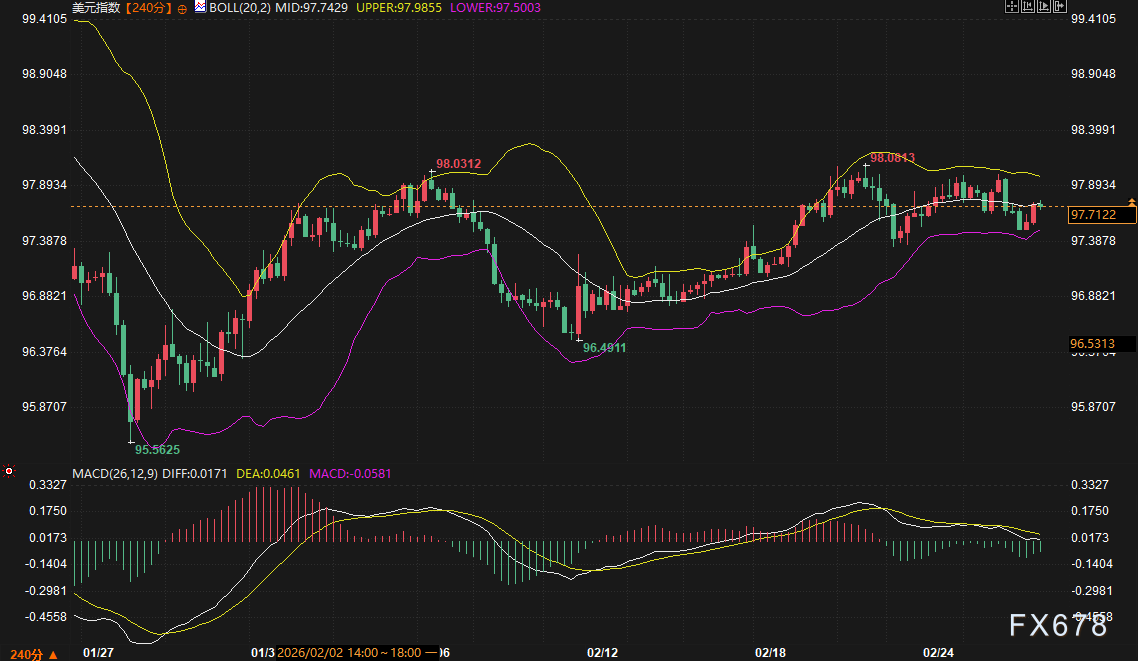
From a technical perspective, looking at the 240-minute candlestick structure of the U.S. Dollar Index, the current price (97.7088) is running below the middle Bollinger Band (97.7427), indicating weak short-term momentum. Notably, after a previous period of narrowing, the Bollinger Bands have expanded again, with the upper band pointing to 97.9855 and the lower band stretching down to 97.5000, which usually signals a significant increase in volatility. As for the MACD indicator, DIFF (0.0168) and DEA (0.0461) are still in a dead cross, but the negative value histogram has been shortening for several sessions, suggesting that bearish momentum is waning and the market may enter a phase of directional indecision in the short term.
The core variable affecting the dollar’s trend is shifting from pure interest rate expectations to the supply and demand structure of the U.S. Treasury market. Yesterday, the U.S. Treasury auctioned $70 billion worth of 5-year notes, with a final winning yield of 3.615%, which was 0.7 basis points above the market yield at the bidding deadline, and the combined allocation ratio for indirect and direct bidders fell to 87.2%, the lowest level since March 2025. This weak auction result shows that, amid uncertainty over tariff policy and a lack of clarity in the global trade situation, overseas institutions and domestic long-term funds are cautious about taking new Treasury positions. Weak demand in the primary market usually suppresses sentiment in the secondary market, thereby limiting the decline in Treasury yields. However, the current market is displaying a “bad news is good news” logic—marginally weaker economic data and geopolitical risks are instead strengthening safe-haven buying, pushing the 10-year Treasury yield closer to the recent low of 4.04%.
Declining Treasury yields directly weaken the dollar’s interest rate advantage. Especially when key maturities on the yield curve (such as the 5-year and 7-year) remain under pressure, the marginal attractiveness of dollar assets to cross-border capital diminishes. Notable institutional analysts point out that although Federal Reserve officials have recently expressed differing views (for example, Schmid emphasized that inflation work is not yet complete, while Musalem believes the risks of inflation and employment are roughly balanced), the market is clearly more focused on whether Bowman’s comments at today’s Senate hearing on regulation will indirectly reveal an assessment of the economic outlook. If Treasury yields break below the 4.03% support, the Dollar Index is likely to further test the 97.50 level.
Bond Market Safe-Haven Signals Strengthen, Gold Gains Multi-Faceted Support
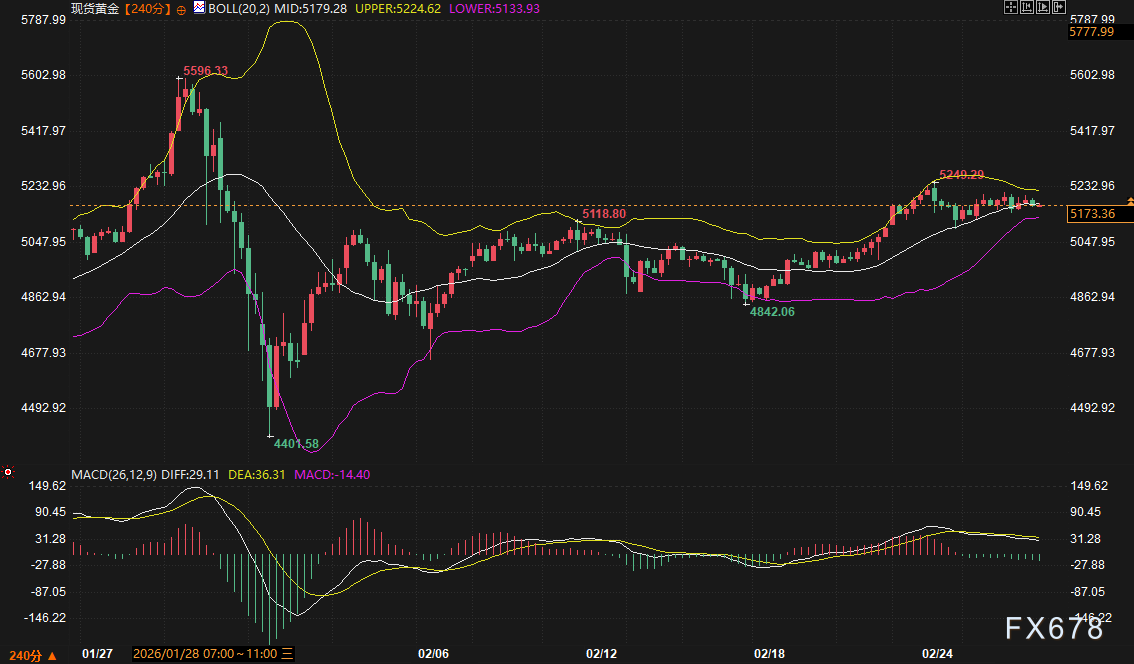
Spot gold has found buying support after this round of pullback to around $5,173 per ounce, and the 240-minute candlestick chart shows prices are seesawing around the middle Bollinger Band ($5,179.27). Although the MACD indicator remains in negative territory (histogram -14.42), the fast line DIFF has begun to flatten, with clear signs of weakening bearish momentum. The adjustment pressure established by the previous high of $5,596.13 is being digested over time, while the key support of $4,842.06 provides a safety cushion for medium-term bulls.
Contrary to conventional analysis that focuses on the negative correlation between the dollar and gold, the current gold pricing logic is more influenced by the transmission of risk-averse sentiment from the bond market. Yesterday, IFR News Flash clearly pointed out, “Although yields are flat, there is still buying in Treasuries due to uncertainties ranging from tariffs to the Iran issue.” This “uncertainty-driven buying” is spilling over into the gold market. On one hand, the decline in real Treasury yields reduces the opportunity cost of holding gold; on the other hand, the tough demands made by the U.S. in the Iran nuclear negotiations and Trump’s warnings to Iran in the State of the Union address have reintroduced a geopolitical risk premium into gold prices. External analyst Carlo Alberto De Casa of Swissquote Bank stated bluntly, “The ongoing tension between Iran and the U.S., combined with global economic uncertainty triggered by Trump’s tariffs, is a bullish catalyst for gold.”
In addition, although the European Central Bank’s reserve adjustment was not directly aimed at gold, the signal it sends is noteworthy. In the first quarter of 2025, the ECB sold some dollar assets and allocated the proceeds to yen. Although the official explanation was “standard rebalancing,” this move occurred before tariff policies triggered market turmoil, objectively reflecting major central banks’ reconsideration of dollar asset concentration. This marginal “de-dollarization” movement globally, together with reports of continued gold purchasing by Asian regions and various central banks, is jointly building the micro-foundation for a long-term bull market in gold.
Bank of Japan Policy Expectations Cause Volatility, But Risk Aversion Remains Dominant
Early this morning, Bank of Japan Governor Kazuo Ueda sent a hawkish signal in an interview, saying that decisions at the March and April meetings will be made based on information, and it is not necessary to wait for the April 1 Tankan survey. This statement once pushed up Japanese bond yields and strengthened the yen. However, the market reaction was relatively restrained, with the 10-year Japanese government bond yield rising only moderately by 3 basis points to 2.165%, indicating that investors still doubt whether the Bank of Japan can truly tighten policy under the prime minister’s preference for a loose policy environment.
For the global bond market, fluctuations in the yen and the rise in Japanese government bond yields have not yet caused a substantive shock. On the one hand, the selling pressure on super-long-term Japanese bonds by Japanese buy-side institutions (such as life insurance companies) has eased, as accounting rule changes have reduced the urgency to liquidate older low-coupon bonds; on the other hand, month-end duration extension demand still supports long-term bonds. This means that the risk of capital outflows from Japan is controllable in the short term, and the main driver of the U.S. Treasury market will continue to focus on U.S. inflation data and Treasury auction results.
2-3 Day Interval Forecast and Key Points to Watch
U.S. Treasuries (10-Year): In the next two trading days, yields are expected to mainly fluctuate between 4.02% and 4.07%. The logic of this range is: 4.02% corresponds to the lower Bollinger Band and the lower edge of a previous volume cluster, and without new risk-aversion events, it is difficult to break below; 4.07% is the high point around yesterday’s auction and a short-term moving average resistance. During the session, pay close attention to weekly initial jobless claims (expected at 215,000) and tonight’s $44 billion 7-year Treasury auction demand. If initial claims are lower than expected and 7-year auction demand is strong, yields may test the upper range.
U.S. Dollar Index: Expected to fluctuate in the 97.50 to 98.00 range. 97.50 corresponds to the lower Bollinger Band on the 240-minute chart and a psychological level, while 98.00 is both a round-number barrier and coincides with the upper band resistance. If Treasury yields fail to break higher, the Dollar Index will struggle to strengthen independently.
Spot gold: Expected to fluctuate in the $5,130–5,225 range. $5,130 corresponds to the area just above the lower Bollinger Band on the 240-minute chart and is also a recent buy zone after pullbacks; $5,225 represents the upper band resistance. If Treasury yields fall further below 4.02% or there are new tensions in the Iran situation, gold prices are expected to challenge the upper end of the range.
Overall, the market is currently in a phase of tug-of-war between a macro data vacuum and geopolitical events. The direction chosen by U.S. Treasury yields will directly determine the short-term trend of both the dollar and gold, with risk-averse logic clearly prevailing in the current environment. Over the next 2-3 trading days, investors should closely monitor marginal changes in U.S. employment data, indirect demand indicators at Treasury auctions, and real-time developments in the Iran nuclear negotiations.
Disclaimer: The content of this article solely reflects the author's opinion and does not represent the platform in any capacity. This article is not intended to serve as a reference for making investment decisions.
You may also like
Is AI Killing SaaS — Or Just Supercharging Salesforce?
Tesla’s Challenges in Europe Persist: Is It Wise to Rely on Their Autonomy Commitments?
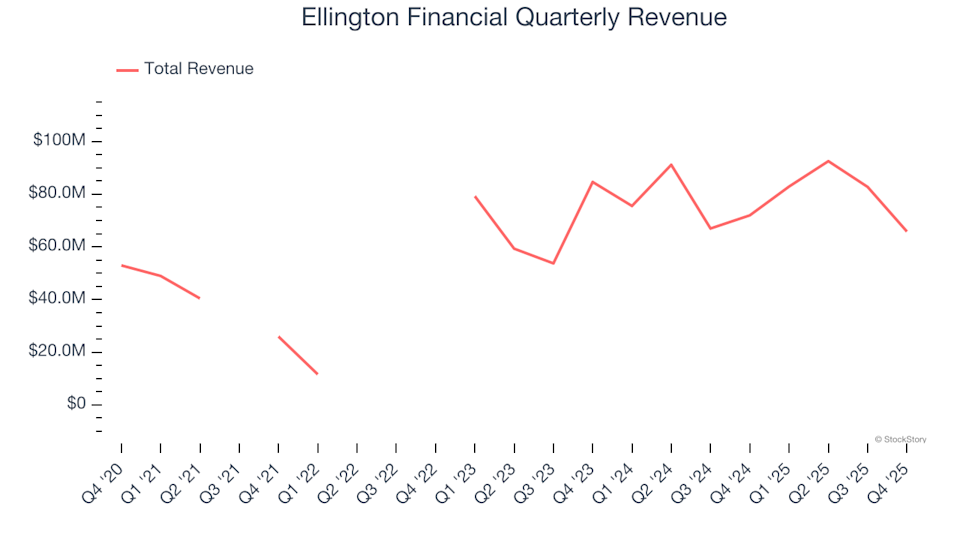
Ellington Financial (NYSE:EFC) Falls Short of Q4 CY2025 Revenue Projections