
Steel stocks have been soaring lately. The chart suggests another significant surge may be on the horizon.

Steel: A Volatile Yet Promising Trading Opportunity
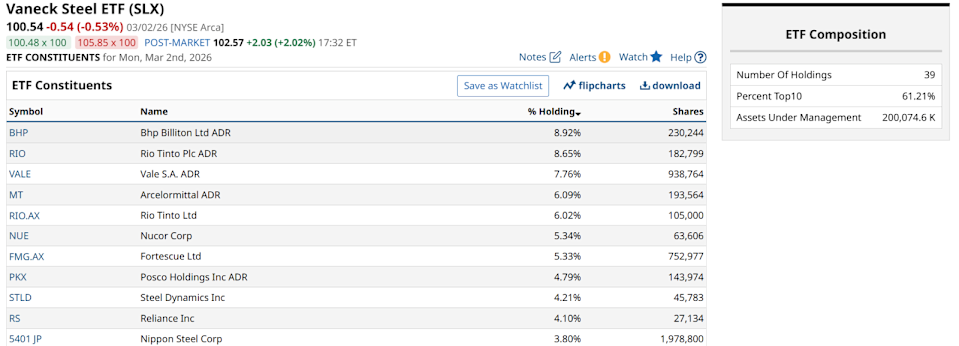
Steel, known for its price swings, remains a popular choice among traders seeking dynamic market opportunities. Personally, I monitor the sector through the VanEck Steel ETF (SLX), which has been tracking the industry for nearly two decades. SLX includes 39 companies, such as Nippon Steel (NPSCY)—the new owner of US Steel—and is heavily weighted, with over 60% of its assets concentrated in its top ten holdings. While the fund is relatively modest in size at $200 million, it has delivered impressive returns at various points.
Latest Insights from Barchart
SLX: A Window into the Global Steel Market
SLX offers both investors and traders focused exposure to the worldwide steel sector, encompassing companies engaged in steel manufacturing, processing, and iron ore extraction. The current outlook for steel is shaped by a major shift toward infrastructure-driven demand and the costly transition to environmentally friendly steel production.
Optimists point to a projected global demand recovery, with estimates suggesting a 1% to 3% increase in 2026. This growth is largely attributed to large-scale infrastructure initiatives in the United States and India, as well as a stabilization in European manufacturing. Additionally, stricter environmental standards are boosting demand for low-emission steel made in electric arc furnaces, creating a so-called “green premium.”
On the other hand, ongoing weakness in China’s property market and resulting fluctuations in raw material prices present significant risks. As the leading producer and consumer of steel, China’s real estate downturn continues to dampen global iron ore sentiment. Production in China is expected to fall by about 4.5% in 2026 due to tougher environmental regulations, but concerns remain about surplus Chinese steel flooding international markets, which could challenge Western producers.
Moreover, steel production is highly dependent on energy. Any abrupt rise in energy prices or disruptions in the supply of coking coal could quickly undermine the profitability of the cyclical companies that make up much of SLX.
SLX Technical Analysis: What Are the Charts Indicating?
Currently, SLX’s price trend appears overextended and may be due for a correction. The Percentage Price Oscillator (PPO) recently signaled a downturn from elevated levels. Simply put, when an entire sector doubles in value within a year—as SLX has—it often suggests the ETF is overvalued by that metric alone.
Evaluating SLX’s Risk and Performance
Despite the sharp price increase, my ROAR Score assessment of SLX reveals that a high price alone doesn’t necessarily mean an ETF or stock is due for a reversal. As of Monday’s close, the ROAR Score stood at 50, indicating a neutral risk level rather than an extreme one.
Looking at the past six months, the lower section of the chart shows that the ROAR Score has consistently avoided the high-risk “red zone.” In fact, it signaled a buying opportunity last September when SLX was trading in the low $70s, and since then, the ETF has climbed over 40%, mostly remaining in a neutral risk state.
Examining SLX’s five-year trajectory reveals a more uncertain price pattern between 2021 and 2024, with the ETF fluctuating between $50 and $70 per share. This period was marked by a volatile ROAR Score, which is typical for assets with significant price swings. Only recently has SLX broken out decisively from this range.
What Lies Ahead for SLX?
At this stage, SLX may not be an ideal candidate for momentum-driven investors, but it has reached new highs. This could mean a substantial pullback and subsequent period of consolidation, potentially setting the stage for another significant rally. Patience will be key, but as the steel industry continues its long-awaited recovery, SLX could once again offer attractive returns for investors.
About the ROAR Score
The ROAR Score, developed by Rob Isbitts, draws on over four decades of technical analysis expertise. This tool is designed to help individual investors manage risk and build their own portfolios. For more of Rob’s research, visit ETFYourself.com.
Disclaimer: The content of this article solely reflects the author's opinion and does not represent the platform in any capacity. This article is not intended to serve as a reference for making investment decisions.
You may also like
BitMine Buys Another 50,000+ ETH and Inches Toward Its 5% Target
Trump's Maritime Insurance Order Sparks Relief Rally: 10 Stocks Moving
Time to Buy the Dip on Struggling Semiconductor Stock
Next Fed Meeting: March Schedule and Anticipated Interest Rate Decisions