
BCP Investment Corporation Announces Fourth Quarter and Full Year 2025 Financial Results

2025, a Transformational Year Marked by Strategic Steps Designed to Enhance Shareholder Value: the Merger with Logan Ridge, Corporate Rebranding and Completion of a Tender Offer
Announces First Quarter 2026 Quarterly Distribution of $0.32 Per Share; Transition to New Monthly Base Distributions of $0.09 Per Share Beginning April 2026 with the Potential for Quarterly Supplemental Distributions; Total Distributions for 2025 of $1.97 Per Share
NEW YORK, March 05, 2026 (GLOBE NEWSWIRE) -- BCP Investment Corporation (NASDAQ: BCIC) (“BCIC” or “the Company”) announced today its financial results for the fourth quarter and full year ended December 31, 2025.
Full Year 2025 Milestones
- On July 15, 2025, the Company successfully completed the merger with Logan Ridge Finance Corporation (“LRFC”) with and into the Company, a major milestone which offered scale, further diversification, and increased operational efficiency.
- On August 22, 2025, the Company completed rebranding and the name change to “BCP Investment Corporation” (NASDAQ: BCIC).
- On October 7, 2025, the Company obtained a BBB- rating from a Nationally Recognized Statistical Rating Organization with respect to the 5.25% fixed-rate convertible notes due 2032 (the “2032 Convertible Notes”) and the 5.25% fixed-rate notes due 2026 (the “2026 Notes”), which resulted in both the 2032 Convertible Notes and 2026 Notes having a fixed interest rate of 5.25% per annum.
- On October 15, 2025, the Company issued $35.0 million of 7.50% notes due 2028, and $75.0 million of 7.75% notes due 2030 (together the “2028 and 2030 Notes”), under an effective shelf registration statement, for a total of $110 million.
- On November 15, 2025, the Company used the proceeds from the issuance of the 2028 and 2030 Notes to redeem in full the $108.0 million aggregate principal amount outstanding of its 4.875% Notes Due 2026.
- On December 12, 2025, the Company completed a tender offer and repurchased 557,960 shares of its common stock at an aggregate cost of approximately $7.6 million.
Fourth Quarter 2025 Highlights
- Total investment income for the fourth quarter of 2025 decreased to $17.5 million, from $18.9 million for the third quarter of 2025.
- Core investment income
1, excluding the impact of purchase price accounting, for the fourth quarter of 2025 was $14.2 million, as compared to $15.3 million for the third quarter of 2025.
- Net investment income (“NII”) for the fourth quarter of 2025 decreased to $7.4 million ($0.57 per share), as compared to $8.8 million ($0.71 per share) in the third quarter of 2025.
- Net asset value (“NAV”), as of December 31, 2025, was $209.2 million ($16.68 per share), as compared to NAV of $231.3 million ($17.55 per share) as of September 30, 2025.
- Deployment of approximately $9.6 million and sales and repayments of approximately $40.4 million, resulting in net repayments and sales of approximately $30.8 million.
- Total shares repurchased by the Company through the modified “Dutch Auction” tender offer and open market transactions were 677,975, which was accretive to NAV by $0.23 per share. Shares repurchased through the “Tender Offer”, which commenced on November 12, 2025 and expired on December 10, 2025, were 557,960 at an aggregate cost of approximately $7.6 million, which was accretive to NAV by $0.18 per share. Total shares repurchased in open market transactions under the Stock Repurchase Program during the quarter ended December 31, 2025, were 120,015 at an aggregate cost of approximately $1.4 million, which was accretive to NAV by $0.05 per share.
- Subsequent to quarter end, announced transition to monthly base distributions beginning in April 2026.
Full Year 2025 Highlights
- Total investment income for the year ended December 31, 2025 was $61.2 million, as compared to $62.4 million in the year ended December 31, 2024.
- Core investment income, excluding the impact of purchase price accounting, for the year ended December 31, 2025 was $54.3 million, as compared to $62.2 million for the year ended December 31, 2024.
- Net investment income (“NII”) for the year ended December 31, 2025 was $25.1 million ($2.28 per share), as compared to $24.0 million ($2.59 per share) for the year ended December 31, 2024.
- Total Deployment of approximately $52.3 million and sales and repayments of approximately $116.9 million, resulting in net repayments and sales of approximately $64.6 million for the year.
- Total shares repurchased by the Company in open market transactions under the Stock Repurchase Program and through the Tender Offer during the year ended December 31, 2025, were 698,548 at an aggregate cost of approximately $9.3 million, which was accretive to NAV by $0.24 per share.
- Total stockholder distributions for 2025 amount to $1.97 per share.
Subsequent Events
- On March 4, 2026, the Board authorized a renewed stock repurchase program of up to $10 million (the “2026 Stock Repurchase Program”) for an approximately one-year period, effective March 4, 2026 and terminating on March 31, 2027. The terms and conditions of the 2026 Stock Repurchase Program are substantially similar to the prior 2025 Repurchase Program. The 2026 Stock Repurchase Program may be suspended or discontinued at any time. Subject to these restrictions, we will selectively pursue opportunities to repurchase shares which are accretive to net asset value per share.
- On March 4, 2026, the Board approved the transition of the Company’s distribution payment schedule from quarterly to monthly, beginning in April 2026. The modification to the distribution policy introduces a stable base distribution, which is anticipated to be sustainable across market cycles, and retains the potential for a quarterly supplemental distribution, which will approximate 50% of the net investment income in excess of the monthly base distributions to account for fluctuations in rates and spreads.
- On March 5, 2026, the Company declared a quarterly base distribution of $0.32 per share of common stock. The distribution is payable on March 27, 2026 to stockholders of record at the close of business on March 16, 2026.
- On March 5, 2026, the Company declared a regular monthly base distribution of $0.09 per share of common stock for each of April, May and June 2026. The April 2026 distribution is payable on April 30, 2026 to stockholders of record at the close of business on April 15, 2026. The May 2026 distribution is payable on May 29, 2026 to stockholders of record at the close of business on May 15, 2026. The June 2026 distribution is payable on June 30, 2026 to stockholders of record at the close of business on June 15, 2026.
________________________________
Management Commentary
Ted Goldthorpe, Chief Executive Officer of BCP Investment Corporation, stated, “2025 was a transformational year for the Company. During the year, we successfully completed our merger with LRFC, executed a rebranding and name change, and launched a tender offer – all of which are initiatives designed to enhance shareholder value.
The merger meaningfully strengthened our platform, expanded our scale, and enhanced our portfolio diversification. At the same time, our rebranding better reflects our affiliation with the broader BC Partners Credit Platform and is a representation of our long-term vision as we position the Company for its next phase of growth.
Additionally, consistent with our diligent capital management strategy, during the year we proactively extended and laddered our unsecured debt maturities, issuing $75 million of 7.75% Notes due October 2030 and $35 million of 7.50% Notes due October 2028, while also redeeming our 4.875% Notes due 2026. These actions further diversified our funding base and provided us with enhanced financial flexibility.
The Board also approved the transition of the Company’s base distribution payment schedule from quarterly to monthly beginning in April 2026, while retaining the potential for quarterly supplemental distributions. We believe this change better aligns our distribution schedule with shareholder interests.
Consistent with previous years, on March 4, 2026, the Board authorized a renewed stock repurchase program of up to $10 million for an approximately one-year period.
Looking ahead, while macroeconomic headwinds persist, we believe current market dynamics continue to create compelling opportunities for our disciplined strategy. We anticipate that 2026 will bring increased activity in the M&A market and expect to capitalize on opportunities in our pipeline.
As always, our focus remains on disciplined capital allocation, strong underwriting standards, and delivering attractive, risk-adjusted returns for our shareholders. With a larger, more diversified platform and reinforced balance sheet, we believe we are well positioned to drive long-term value creation and generate sustainable, risk-adjusted returns.”
Selected Financial Highlights for Full Year 2025
- Total investment income for the year ended December 31, 2025, was $61.2 million, of which $55.1 million was attributable to interest income, inclusive of payment-in-kind income, from the Debt Securities Portfolio. This compares to total investment income of $62.4 million for the year ended December 31, 2024, of which $52.6 million was attributable to interest income, inclusive of payment-in-kind income, from the Debt Securities Portfolio.
- Core investment income for the year ended December 31, 2025, excluding the impact of purchase discount accretion, was $54.3 million, as compared to core investment income of $62.2 million for the year ended December 31, 2024.
- Net investment income (“NII”) for the year ended December 31, 2025, was $25.1 million ($2.28 per share) as compared to $24.0 million ($2.59 per share) for the year ended December 31, 2024.
- Net asset value (“NAV”) as of December 31, 2025, was $209.2 million ($16.68 per share), as compared to $178.5 million ($19.41 per share) for the fourth quarter of 2024.
- Investment portfolio at fair value as of December 31, 2025, was $501.0 million, comprised of 108 different entities. Our debt investment portfolio, excluding our investments in the CLO Funds, equities and Joint Ventures, totaled $411.6 million at fair value as of December 31, 2025, and was spread across 34 different industries comprised of 74 different portfolio companies with an average par balance per investment of approximately $3.5 million. This compares to a total investment portfolio at fair value as of December 31, 2024, of $405.0 million, comprised of 93 different entities. Our debt investment portfolio, excluding our investments in the CLO Funds, equities and Joint Ventures, totaled $320.7 million at fair value as of December 31, 2024, spread across 30 different industries (based on alignment to GICS level 3) and comprised of 71 different portfolio companies, with an average par balance per investment of approximately $2.5 million.
- Debt investments on non-accrual, as of December 31, 2025, were 13 attributable to 10 portfolio companies, representing 4.0% and 7.1% of the Company’s investment portfolio at fair value and amortized cost, respectively. This compares to 6 debt investments attributable to 5 portfolio companies, representing 1.7% and 3.4% of the Company’s investment portfolio at fair value and amortized cost, respectively, as of December 31, 2024. For illustrative purposes, if you were to combine the Company’s investment portfolio with LRFC’s as of December 31, 2024, the Company would have had 9 debt investments attributable to 7 portfolio companies on non-accrual status representing 2.6% and 5.0% of the combination of the Company’s and LRFC’s investment portfolio at fair value and amortized cost, respectively, as of December 31, 2024.
- Weighted average annualized yield was approximately 12.9% (excluding income from non-accruals and collateralized loan obligations) as of December 31, 2025.
- Par value of outstanding borrowings, as of December 31, 2025, was $312.3 million, which compares to $267.5 million from December 31, 2024, with an asset coverage ratio of 167% as compared to 167% as of December 31, 2024. On a net basis, leverage as of December 31, 2025, was 1.4x
2compared to 1.3x2as of December 31, 2024.
________________________________
Results of Operations
Operating results for the year ended December 31, 2025, and December 31, 2024, were as follows:
| For the Year Ended December 31, | |||||||||||
| ($ in thousands, except share and per share amounts) | 2025 | 2024 | |||||||||
| Total investment income | $ | 61,152 | $ | 62,432 | |||||||
| Net expenses | 36,020 | 38,388 | |||||||||
| Net Investment Income | 25,132 | 24,044 | |||||||||
| Net realized gain (loss) on investments | (21,436 | ) | (31,183 | ) | |||||||
| Net change in unrealized gain (loss) on investments | 6,547 | 1,006 | |||||||||
| Tax (provision) benefit on realized and unrealized gains (losses) on investments | 1,611 | 853 | |||||||||
| Net realized and unrealized appreciation (depreciation) on investments, net of taxes | (13,278 | ) | (29,324 | ) | |||||||
| Net realized gain (loss) on extinguishment of debt | (362 | ) | (655 | ) | |||||||
| Net Increase (Decrease) in Net Assets Resulting from Operations | $ | 11,492 | $ | (5,935 | ) | ||||||
| Net Increase (Decrease) In Net Assets Resulting from Operations per Common Share: | |||||||||||
| Basic: | $1.04 | ($0.64 | ) | ||||||||
| Diluted: | $1.04 | ($0.64 | ) | ||||||||
| Net Investment Income Per Common Share: | |||||||||||
| Basic: | $2.28 | $2.59 | |||||||||
| Diluted: | $2.27 | $2.59 | |||||||||
| Weighted Average Shares of Common Stock Outstanding — Basic | 11,001,571 | 9,272,809 | |||||||||
| Weighted Average Shares of Common Stock Outstanding — Diluted | 11,096,227 | 9,272,809 | |||||||||
Investment Income
The composition of our investment income for the year ended December 31, 2025, and December 31, 2024, was as follows:
| For the Year Ended December 31, | |||||||
| ($ in thousands) | 2025 | 2024 | |||||
| Interest income, excluding CLO income and purchase discount accretion | $ | 38,543 | $ | 45,149 | |||
| Purchase discount accretion | 6,895 | 235 | |||||
| PIK income | 10,523 | 8,186 | |||||
| CLO income | 370 | 1,511 | |||||
| Joint Venture income | 4,327 | 6,576 | |||||
| Fees and other income | 494 | 775 | |||||
| Investment Income | $ | 61,152 | $ | 62,432 | |||
| Less: Purchase discount accretion | $ | (6,895 | ) | $ | (235 | ) | |
| Core Investment Income | $ | 54,257 | $ | 62,197 | |||
Fair Value of Investments
The composition of our investment portfolio as of December 31, 2025, and December 31, 2024, at cost and fair value was as follows:
| ($ in thousands) | December 31, 2025 | December 31, 2024 | ||||||||||||||||||||||
| Security Type | Cost/Amortized Cost |
Fair Value | Fair Value Percentage of Total Portfolio | Cost/Amortized Cost |
Fair Value | Fair Value Percentage of Total Portfolio | ||||||||||||||||||
| First Lien Debt | $ | 360,556 | $ | 344,126 | 68.7 | % | $ | 311,673 | $ | 289,957 | 71.6 | % | ||||||||||||
| Second Lien Debt | 49,777 | 42,183 | 8.4 | % | 34,892 | 28,996 | 7.2 | % | ||||||||||||||||
| Subordinated Debt | 27,487 | 25,339 | 5.1 | % | 8,059 | 1,740 | 0.4 | % | ||||||||||||||||
| Collateralized Loan Obligations | 1,381 | 1,789 | 0.4 | % | 5,318 | 5,193 | 1.3 | % | ||||||||||||||||
| Joint Ventures | 64,403 | 48,165 | 9.6 | % | 66,747 | 54,153 | 13.4 | % | ||||||||||||||||
| Equity | 44,413 | 39,193 | 7.8 | % | 31,921 | 24,762 | 6.1 | % | ||||||||||||||||
| Asset Manager Affiliates
(1)
|
17,791 | — | — | 17,791 | — | — | ||||||||||||||||||
| Derivatives | 31 | 180 | 0.0 | % | 31 | 220 | — | |||||||||||||||||
| Total | $ | 565,839 | $ | 500,975 | 100.0 | % | $ | 476,432 | $ | 405,021 | 100.0 | % | ||||||||||||
|
(1)
Represents the equity investment in the Asset Manager Affiliates. |
||||||||||||||||||||||||
Liquidity and Capital Resources
As of December 31, 2025, the Company had approximately $312.3 million (par value) of outstanding borrowings at a current weighted average interest rate of 6.9%, of which $162.0 million par value had a fixed rate and $150.3 million par value had a floating rate.
As of December 31, 2025, and December 31, 2024, the fair value of investments and cash were as follows:
| ($ in thousands) | ||||||||
| Security Type | December 31, 2025 |
December 31, 2024 |
||||||
| Cash and Cash Equivalents | $ | 3,721 | $ | 17,532 | ||||
| Restricted Cash | 8,782 | 22,421 | ||||||
| First Lien Debt | 344,126 | 289,957 | ||||||
| Second Lien Debt | 42,183 | 28,996 | ||||||
| Subordinated Debt | 25,339 | 1,740 | ||||||
| Equity | 39,193 | 24,762 | ||||||
| Collateralized Loan Obligations | 1,789 | 5,193 | ||||||
| Joint Ventures | 48,165 | 54,153 | ||||||
| Derivatives | 180 | 220 | ||||||
| Total | $ | 513,478 | $ | 444,974 | ||||
As of December 31, 2025, the Company had unrestricted cash of $3.7 million and restricted cash of $8.8 million. This compares to unrestricted cash of $17.5 million and restricted cash of $22.4 million as of December 31, 2024. As of December 31, 2025, the Company had $92.4 million of available borrowing capacity under the JPM Credit Facility and $32.3 million of available borrowing capacity under the KB Credit Facility.
Interest Rate Risk
The Company’s investment income is affected by fluctuations in various interest rates, including SOFR and prime rates.
As of December 31, 2025, approximately 86.8% of our Debt Securities Portfolio at par value were floating rate with a spread to an interest rate index such as SOFR. 89.5% of these floating rate loans contain floors ranging between 0.50% and 5.25%. We generally expect that future portfolio investments will predominately be floating rate investments.
In periods of rising or lowering interest rates, the cost of the portion of debt associated with the 2028 Notes, 2030 Notes, 2032 Convertible Notes and 2026 Notes would remain the same, given that this debt is at a fixed rate, while the interest rate on borrowings under the Great Lakes Portman Ridge Funding LLC Revolving Credit Facility and the KeyBank Credit Facility would fluctuate with changes in interest rates.
Generally, the Company would expect that an increase in the base rate index for floating rate investment assets would increase gross investment income and a decrease in the base rate index for such assets would decrease gross investment income (in either case, such increase/decrease may be limited by interest rate floors/minimums for certain investment assets).
| Impact on net investment income from a change in interest rates at: |
||||||||||||
| ($ in thousands) | 1% | 2% | 3% | |||||||||
| Increase in interest rate | $ | 2,117 | $ | 4,260 | $ | 6,442 | ||||||
| Decrease in interest rate | $ | (2,075 | ) | $ | (3,913 | ) | $ | (4,704 | ) | |||
Conference Call and Webcast
We will hold a conference call on Friday, March 6, 2026, at 10:00 am Eastern Time to discuss our fourth quarter and full year 2025 financial results.
A replay of this conference call will be available shortly after the live call through March 13, 2026.
A live audio webcast of the conference call can be accessed via the Internet, on a listen-only basis. The online archive of the webcast will be available on the Company’s website shortly after the call in the Investor Relations section under Events and Presentations.
About BCP Investment Corporation
BCP Investment Corporation (NASDAQ: BCIC) is a publicly traded, externally managed closed-end investment company that has elected to be regulated as a business development company under the Investment Company Act. BCIC’s middle market investment business originates, structures, finances and manages a portfolio of term loans, mezzanine investments and selected equity securities in middle market companies. BCIC’s investment activities are managed by its investment adviser, Sierra Crest Investment Management LLC, an affiliate of BC Partners Advisors L.P.
BCIC’s filings with the Securities and Exchange Commission (the “SEC”), earnings releases, press releases and other financial, operational and governance information are available on BCIC’s website.
About BC Partners Advisors L.P. and BC Partners Credit
BC Partners is a leading international investment firm in private equity, private credit and real estate strategies. Established in 1986, BC Partners has played an active role in developing the European buyout market for three decades.
Today, BC Partners executives operate across markets as an integrated team through the firm’s offices in North America and Europe.
BC Partners Credit was launched in February 2017 and has pursued a strategy focused on identifying attractive credit opportunities in any market environment and across sectors, leveraging the deal sourcing and infrastructure made available from BC Partners.
Cautionary Statement Regarding Forward-Looking Statements
This press release contains forward-looking statements. The matters discussed in this press release, as well as in future oral and written statements by management of BCP Investment Corporation, that are forward-looking statements are based on current management expectations that involve substantial risks and uncertainties which could cause actual results to differ materially from the results expressed in, or implied by, these forward-looking statements. Forward-looking statements relate to future events or our future financial performance and include, but are not limited to, projected financial performance, expected development of the business, plans and expectations about future investments and the future liquidity of the Company. We generally identify forward-looking statements by terminology such as “may,” “will,” “should,” “expects,” “plans,” “anticipates,” “could,” “intends,” “target,” “projects,” “outlook”, “contemplates,” “believes,” “estimates,” “predicts,” “potential” or “continue” or the negative of these terms or other similar words. Forward-looking statements are based upon current plans, estimates and expectations that are subject to risks, uncertainties, and assumptions. Should one or more of these risks or uncertainties materialize, or should the underlying assumptions prove to be incorrect, actual results may vary materially from those indicated or anticipated by such forward-looking statements.
Important assumptions include our ability to originate new investments, and achieve certain margins and levels of profitability, the availability of additional capital, and the ability to maintain certain debt to asset ratios. In light of these and other uncertainties, the inclusion of a projection or forward-looking statement in this press release should not be regarded as a representation that such plans, estimates, expectations or objectives will be achieved. Important factors that could cause actual results to differ materially from such plans, estimates or expectations include, among others, (1) uncertainty of the expected financial performance of the Company; (2) expected synergies and savings associated with merger transactions effectuated by the Company; (3) the ability of the Company and/or its adviser to implement its business strategy; (4) evolving legal, regulatory and tax regimes; (5) changes in general economic and/or industry specific conditions, including but not limited to the impact of inflation; (6) the impact of increased competition; (7) business prospects and the prospects of the Company’s portfolio companies; (8) contractual arrangements with third parties; (9) any future financings by the Company; (10) the ability of Sierra Crest Investment Management LLC to attract and retain highly talented professionals; (11) the Company’s ability to fund any unfunded commitments; (12) any future distributions by the Company; (13) changes in regional or national economic conditions and their impact on the industries in which we invest; (14) the Company’s ability and expectation to complete its tender offer; and (15) other changes in the conditions of the industries in which we invest and other factors enumerated in our filings with the SEC. The forward-looking statements should be read in conjunction with the risks and uncertainties discussed in the Company’s filings with the SEC, including the Company’s most recent Form 10-K and other SEC filings. We do not undertake to publicly update or revise any forward-looking statements, whether as a result of new information, future events or otherwise, except as required to be reported under the rules and regulations of the SEC. Although the Company undertakes no obligation to revise or update any forward-looking statements, whether as a result of new information, future events or otherwise, you are advised to consult any additional disclosures that they may make directly to you or through reports that the Company in the future may file with the SEC, including annual reports on Form 10-K, quarterly reports on Form 10-Q and current reports on Form 8-K.
Contacts:
BCP Investment Corporation
650 Madison Avenue, 3rd floor
New York, NY 10022
Brandon Satoren
Chief Financial Officer
(212) 891-2880
| BCP INVESTMENT CORPORATION CONSOLIDATED STATEMENTS OF ASSETS AND LIABILITIES |
|||||||
| December 31, 2025 | December 31, 2024 | ||||||
| ASSETS | |||||||
| Investments at fair value: | |||||||
| Non-controlled/non-affiliated investments (amortized cost of $433,213 and $358,153, respectively) | $ | 409,735 | $ | 327,622 | |||
| Non-controlled affiliated investments (amortized cost of $90,294 and $68,858, respectively) | 80,585 | 64,384 | |||||
| Controlled affiliated investments (amortized cost of $42,332 and $49,421, respectively) | 10,655 | 13,015 | |||||
| Total Investments at fair value (amortized cost of $565,839 and $476,432, respectively) | $ | 500,975 | $ | 405,021 | |||
| Cash and cash equivalents | 3,721 | 17,532 | |||||
| Restricted cash | 8,782 | 22,421 | |||||
| Interest receivable | 5,793 | 6,088 | |||||
| Dividend receivable | 845 | 1,367 | |||||
| Other assets | 3,525 | 1,205 | |||||
| Total Assets | $ | 523,641 | $ | 453,634 | |||
| LIABILITIES | |||||||
| 4.875% Notes due 2026 (net of deferred financing costs and original issue discount of $— and $1,017, respectively) | $ | — | $ | 106,983 | |||
| Great Lakes Portman Ridge Funding LLC Revolving Credit Facility (net of deferred financing costs of $825 and $1,322, respectively) | 106,804 | 158,157 | |||||
| 2026 Notes (net of deferred financing costs and original issue discount of $312 and $—, respectively) | 49,688 | — | |||||
| 2032 Convertible Notes (net of deferred financing costs and original issue discount of $102 and $—, respectively) | 1,898 | — | |||||
| KeyBank Credit Facility (net of deferred financing costs of $904 and $—, respectively) | 41,765 | — | |||||
| 2028 Notes (net of deferred financing costs and original issue discount of $851 and $—, respectively) | 34,149 | — | |||||
| 2030 Notes (net of deferred financing costs and original issue discount of $2,423 and $—, respectively) | 72,577 | — | |||||
| Management and incentive fees payable | 1,865 | 2,713 | |||||
| Accounts payable, accrued expenses and other liabilities | 1,714 | 3,007 | |||||
| Accrued interest payable | 4,025 | 3,646 | |||||
| Due to affiliates | — | 635 | |||||
| Total Liabilities | $ | 314,485 | $ | 275,141 | |||
| COMMITMENTS AND CONTINGENCIES | |||||||
| NET ASSETS | |||||||
| Common stock, par value $0.01 per share, 20,000,000 common shares authorized; 14,003,016 issued, and 12,541,858 outstanding at December 31, 2025, and 9,960,785 issued, and 9,198,175 outstanding at December 31, 2024 | $ | 125 | $ | 92 | |||
| Capital in excess of par value | 811,111 | 714,331 | |||||
| Total distributable (loss) earnings | (602,080 | ) | (535,930 | ) | |||
| Total Net Assets | $ | 209,156 | $ | 178,493 | |||
| Total Liabilities and Net Assets | $ | 523,641 | $ | 453,634 | |||
| Net Asset Value Per Common Share | $ | 16.68 | $ | 19.41 | |||
BCP INVESTMENT CORPORATION
CONSOLIDATED STATEMENTS OF OPERATIONS
| For the Year Ended December 31, | ||||||||||||
| 2025 | 2024 | 2023 | ||||||||||
| INVESTMENT INCOME | ||||||||||||
| Interest income: | ||||||||||||
| Non-controlled/non-affiliated investments | $ | 42,204 | $ | 45,036 | $ | 55,675 | ||||||
| Non-controlled affiliated investments | 3,604 | 1,859 | 2,728 | |||||||||
| Total interest income | 45,808 | 46,895 | 58,403 | |||||||||
| Payment-in-kind income: | ||||||||||||
| Non-controlled/non-affiliated investments
(1)
|
9,737 | 7,472 | 6,662 | |||||||||
| Non-controlled affiliated investments | 786 | 714 | 406 | |||||||||
| Total payment-in-kind income | 10,523 | 8,186 | 7,068 | |||||||||
| Dividend income: | ||||||||||||
| Non-controlled affiliated investments | 4,327 | 6,576 | 6,764 | |||||||||
| Controlled affiliated investments | — | — | 2,184 | |||||||||
| Total dividend income | 4,327 | 6,576 | 8,948 | |||||||||
| Fees and other income: | ||||||||||||
| Non-controlled/non-affiliated investments | 411 | 775 | 1,882 | |||||||||
| Non-controlled affiliated investments | 83 | — | 14 | |||||||||
| Total fees and other income | 494 | 775 | 1,896 | |||||||||
| Total investment income | $ | 61,152 | $ | 62,432 | $ | 76,315 | ||||||
| EXPENSES | ||||||||||||
| Management fees | 6,584 | 6,559 | 7,452 | |||||||||
| Performance-based incentive fees | 2,975 | 5,012 | 7,374 | |||||||||
| Interest and amortization of debt issuance costs | 20,602 | 20,782 | 25,306 | |||||||||
| Professional fees | 2,053 | 1,873 | 1,999 | |||||||||
| Administrative services expense | 2,010 | 1,771 | 2,377 | |||||||||
| Directors’ expense | 550 | 610 | 630 | |||||||||
| Other general and administrative expenses | 1,434 | 1,781 | 1,713 | |||||||||
| Total expenses | $ | 36,208 | $ | 38,388 | $ | 46,851 | ||||||
| Expense reimbursement | — | — | (5,309 | ) | ||||||||
| Waiver of performance-based incentive fees | (188 | ) | — | — | ||||||||
| Net expenses | 36,020 | 38,388 | 41,542 | |||||||||
| NET INVESTMENT INCOME | $ | 25,132 | $ | 24,044 | $ | 34,773 | ||||||
| REALIZED AND UNREALIZED GAINS (LOSSES) ON INVESTMENTS: | ||||||||||||
| Net realized gains (losses) from investment transactions | ||||||||||||
| Non-controlled/non-affiliated investments | $ | (15,478 | ) | $ | (23,205 | ) | $ | (26,334 | ) | |||
| Non-controlled affiliated investments | 234 | (1,334 | ) | (399 | ) | |||||||
| Controlled affiliated investments | (6,192 | ) | (6,644 | ) | (33 | ) | ||||||
| Net realized gain (loss) on investments | (21,436 | ) | (31,183 | ) | (26,766 | ) | ||||||
| Net change in unrealized appreciation (depreciation) on: | ||||||||||||
| Non-controlled/non-affiliated investments | 7,093 | (2,446 | ) | 6,696 | ||||||||
| Non-controlled affiliated investments | (5,235 | ) | (4,085 | ) | 980 | |||||||
| Controlled affiliated investments | 4,729 | 7,317 | (4,354 | ) | ||||||||
| Derivatives | (40 | ) | 220 | — | ||||||||
| Net change in unrealized gain (loss) on investments | 6,547 | 1,006 | 3,322 | |||||||||
| Tax (provision) benefit on realized and unrealized (gains) losses on investments | 1,611 | 853 | 414 | |||||||||
| Net realized and unrealized appreciation (depreciation) on investments, net of taxes | (13,278 | ) | (29,324 | ) | (23,030 | ) | ||||||
| Realized gains (losses) on extinguishment of debt | (362 | ) | (655 | ) | (362 | ) | ||||||
| NET INCREASE (DECREASE) IN NET ASSETS RESULTING FROM OPERATIONS | $ | 11,492 | $ | (5,935 | ) | $ | 11,381 | |||||
| Net Increase (Decrease) In Net Assets Resulting from Operations per Common Share: | ||||||||||||
| Net increase (decrease) in net assets per share resulting from operations – Basic | $ | 1.04 | $ | (0.64 | ) | $ | 1.20 | |||||
| Weighted average common stock outstanding – Basic | 11,001,571 | 9,272,809 | 9,509,396 | |||||||||
| Net increase (decrease) in net assets per share resulting from operations – Diluted | $ | 1.04 | $ | (0.64 | ) | $ | 1.20 | |||||
| Weighted average common stock outstanding – Diluted | 11,096,227 | 9,272,809 | 9,509,396 | |||||||||
| Net Investment Income Per Common Share: | ||||||||||||
| Net investment income - Basic | $ | 2.28 | $ | 2.59 | $ | 3.66 | ||||||
| Net investment income - Diluted | $ | 2.27 | $ | 2.59 | $ | 3.66 | ||||||
(1) During the years ended December 31, 2025, December 31, 2024, and December 31, 2023, the Company received $0.1 million, $0.1 million and $0.6 million, respectively, of non-recurring fee income that was paid in-kind and included in this financial statement line item.

Disclaimer: The content of this article solely reflects the author's opinion and does not represent the platform in any capacity. This article is not intended to serve as a reference for making investment decisions.
You may also like
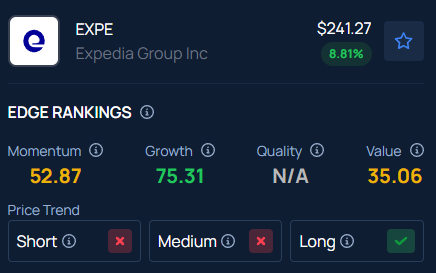
Expedia Group (EXPE) Stock Is Trending Overnight: What You Should Know
Foxconn reports that the Iran conflict has had minimal effects up to now
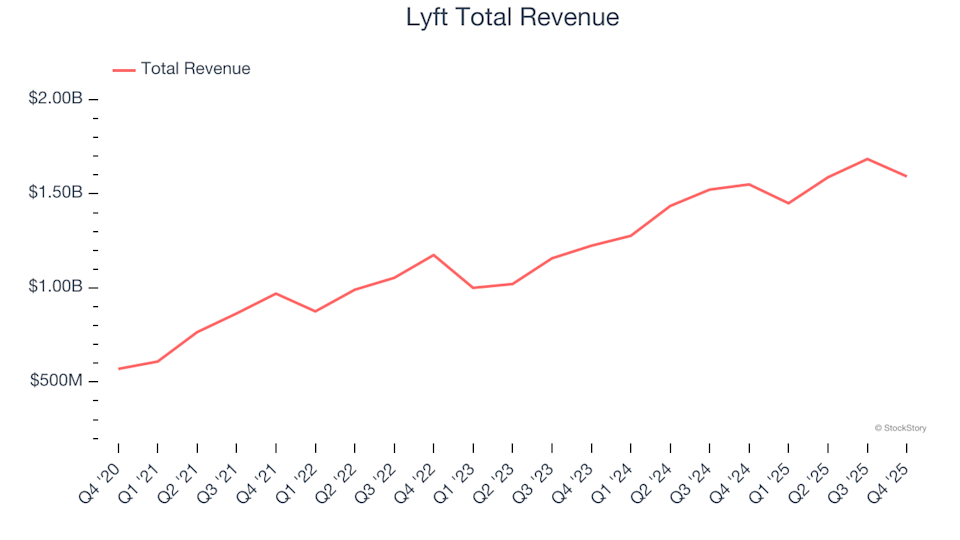
Spotting Top Performers: Lyft (NASDAQ:LYFT) and Gig Economy Shares in the Fourth Quarter
Bittensor (TAO) Tests Crucial $180 Level Amid Renewed AI + Crypto Interest