Ethereum struggles below $2K as pressure builds

Ethereum traded near $1,939 on March 8, remaining below the key $2,000 psychological level as technical indicators across multiple timeframes signalled fading upward momentum.
On the daily chart, ether continues to trade beneath a cluster of longer-term trend indicators, reinforcing a broader corrective structure within a multi-month downward channel.
Attempts to reclaim resistance near $1,980 to $2,000 have repeatedly failed, leaving the $1,930 level as the immediate support zone traders are closely monitoring.
Shorter-term charts show consolidation with a mild bearish tilt after rejection near the $1,960 to $1,980 region, reflecting indecision between momentum traders and longer-term participants.
Momentum indicators remain largely neutral, with the relative strength index at 42.4, the stochastic oscillator at 40.4, and the commodity channel index at −47.7, suggesting limited directional conviction.
Most major moving averages remain above the current price, including the 10-period EMA near $1,990 and the 50-period EMA around $2,249, reinforcing the prevailing downward pressure.
Disclaimer: The content of this article solely reflects the author's opinion and does not represent the platform in any capacity. This article is not intended to serve as a reference for making investment decisions.
You may also like
AUD/JPY Price Forecast: Gathers strength above 111.00 with bullish bias intact
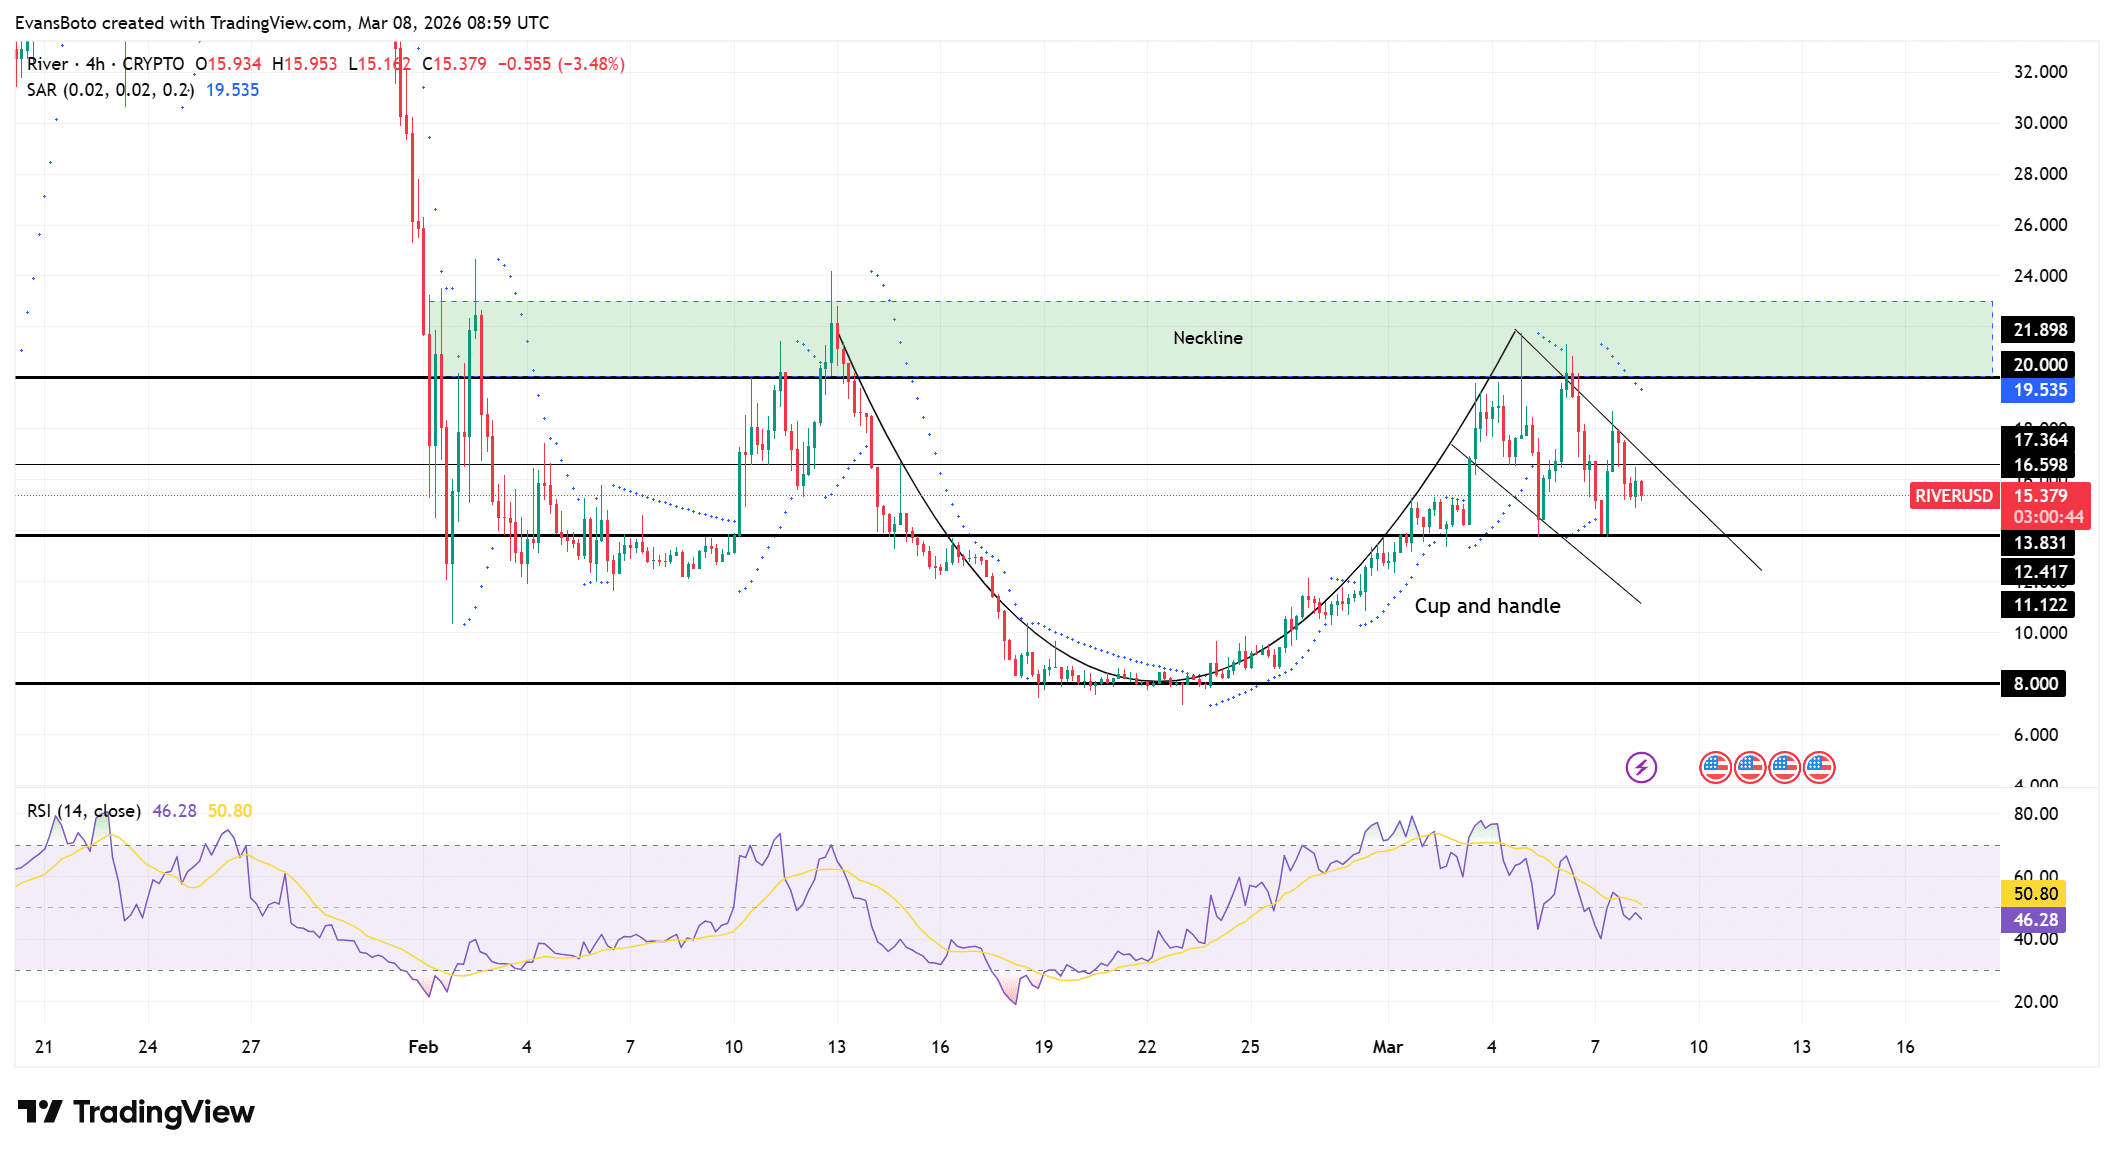
River crypto primed for $20 breakout? THIS structure hints at…
Strategy could buy Bitcoin again

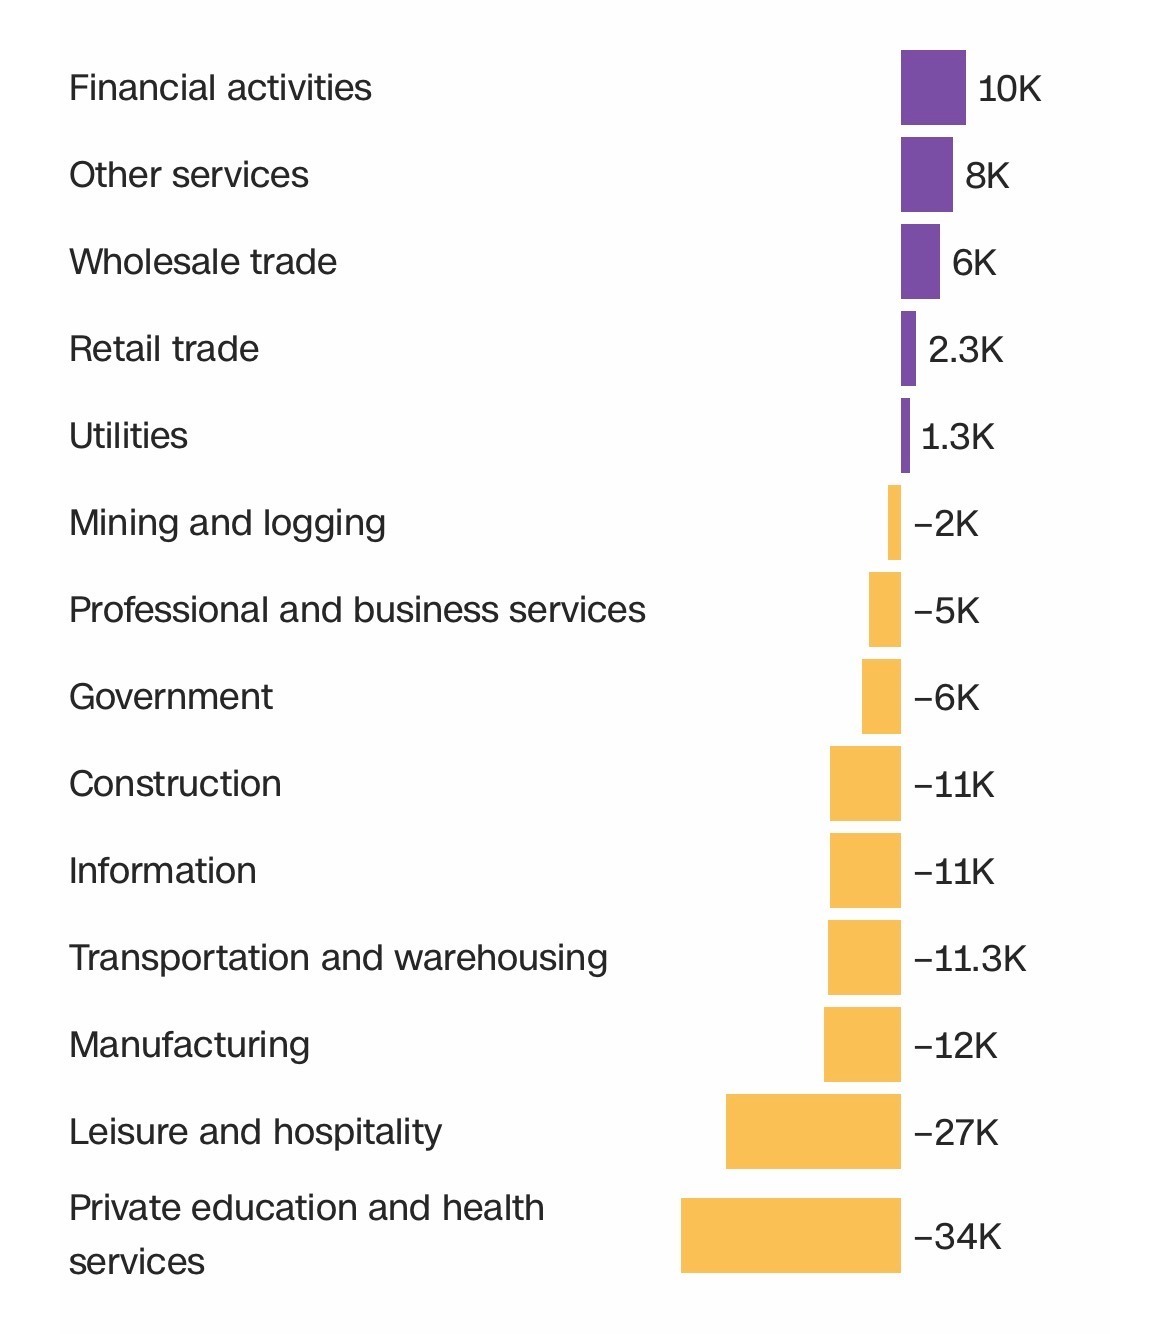
Finance job openings at 2012 levels, US lost 92K jobs last month