Chart (GTLS): 3 Factors That Make This Stock Attractive

Chart Industries: Current Performance and Investment Outlook
Chart Industries (GTLS) is trading at $206.79 per share, with only modest growth of 3.7% over the past half-year. Investors may be wondering if this is an opportune moment to buy, or if the current valuation already reflects the company’s strengths and fundamentals.
What Makes Chart Industries Stand Out?
Chart Industries, listed on the NYSE as GTLS, is known for its role in installing the first bulk CO2 tank for McDonald’s beverage systems. The company specializes in manufacturing equipment that enables the storage and transportation of gases.
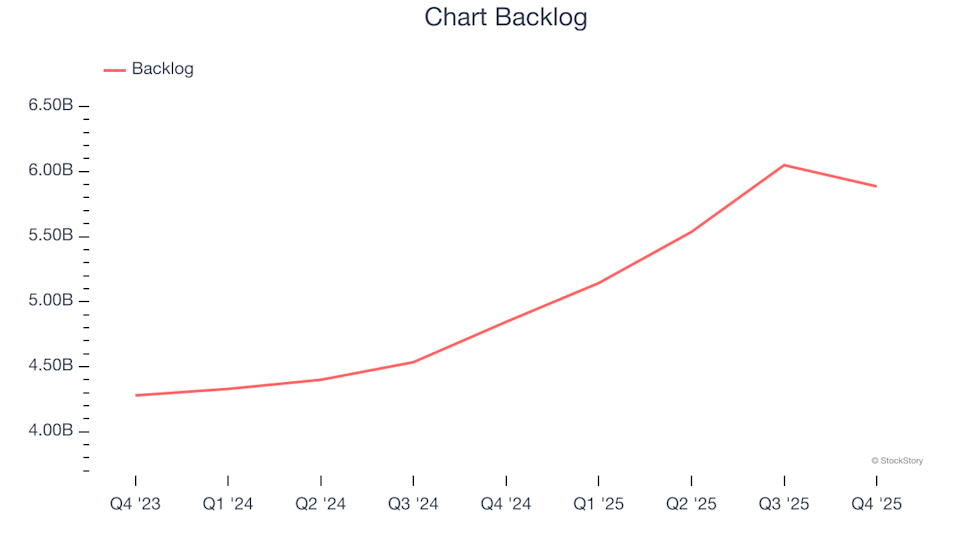
1. Expanding Backlog Secures Future Revenue
For companies in the gas and liquid handling sector, backlog figures offer valuable insight into future sales potential. This metric represents the total value of orders received but not yet fulfilled, providing a window into upcoming revenue streams.
In the most recent quarter, Chart’s backlog reached $5.89 billion. Over the past two years, this figure has grown at an average annual rate of 22.5%. Such impressive growth highlights a strong pipeline of sales, with demand outpacing the company’s ability to deliver. This trend also indicates that customers are making long-term commitments to Chart, enhancing the predictability of its business.
2. Exceptional Long-Term EPS Growth
Monitoring long-term changes in earnings per share (EPS) helps determine whether a company’s expansion is translating into profitability.
Chart Industries has achieved a remarkable compounded annual EPS growth rate of 24.4% over the last five years, outperforming most peers in the industrial sector.
3. Rising Free Cash Flow Margin Strengthens Financials
While free cash flow isn’t always highlighted in financial reports, it’s a crucial measure because it factors in all operating and capital expenditures, making it a reliable indicator of financial health. Ultimately, cash flow is a key driver of business value.
Over the past five years, Chart’s free cash flow margin has increased by 10.4 percentage points. This improvement signals a shift toward a less capital-intensive model, as free cash flow profitability has grown faster than operating profitability. For the trailing twelve months, the company’s free cash flow margin stood at 4.8%.
Conclusion: Is Chart Industries a Buy?
These factors illustrate why Chart Industries is a compelling business. However, with shares priced at $206.79 and a forward P/E ratio of 15.9, is it the right time to invest?
Discover Even More Promising Stocks
Don’t Miss: Our Top 9 Market-Beating Stocks. The most successful stocks consistently outperform the market, fueled by strong revenue growth, expanding free cash flow, and exceptional returns on capital. These companies have already delivered impressive results for investors.
Our AI-driven platform suggests there’s still room for growth. See which nine stocks made this week’s list—absolutely free.
Our selections include well-known names like Nvidia, which soared 1,326% from June 2020 to June 2025, as well as lesser-known companies such as Comfort Systems, which delivered a 782% return over five years.
Disclaimer: The content of this article solely reflects the author's opinion and does not represent the platform in any capacity. This article is not intended to serve as a reference for making investment decisions.
You may also like
3 Meme Coins To Watch In The Third Week Of March 2026
Hedera Price Rejection at $0.095 Signals Possible 21% Downside Risk

Silvercrest (SAMG) Falls Short of Q4 Earnings Expectations
APEMARS Rockets $1K to $43K – Here’s Why It’s the Best Crypto to Buy Today as Falcon Finance Holds and Solana Climbs