XRP Liquidation Heatmap Is Screaming. Here’s What It Says

The latest liquidation data for XRP is shaping market expectations as traders focus on liquidity clusters rather than short-term price swings.
Recent price action shows a clear move to $1.6 followed by long liquidations and a return to a major liquidity zone. This structure now places XRP in a technically important area where liquidity sits below and above the current price.
Crypto analyst Xaif (@Xaif_Crypto) summarized the situation directly, stating, “XRP Liquidation Heatmap is SCREAMING”. Large liquidation clusters often act as magnets for price because they represent areas where leveraged positions can be forced closed.
🔥 XRP Liquidation Heatmap is SCREAMING
Price pumped to $1.60, liquidated longs, and now we're hovering above one of the biggest liquidation clusters of the month.
Market makers know where the stops are.
— Xaif Crypto🇮🇳|🇺🇸 (@Xaif_Crypto) March 21, 2026
Liquidation Clusters Now Control Structure
The chart shows heavy liquidation zones stacked between $1.3 and $1.55. XRP recently moved up to $1.6, where long positions were liquidated, then moved back down into a high liquidity region. Xaif explained the move clearly, saying, “Price pumped to $1.6, liquidated longs, and now we’re hovering above one of the biggest liquidation clusters of the month.”
This matters because liquidation clusters often act as targets. These zones can influence short-term direction because they represent liquidity that large players can use to enter or exit positions.
The heatmap shows the largest concentration of liquidity sitting below the current price zone, with additional clusters above the $1.5 region. This creates a range where price can move between liquidity zones as positions build on both sides.
We are on X, follow us to connect with us :-
— TimesTabloid (@TimesTabloid1) June 15, 2025
What This Means for XRP Price Action
The largest liquidation cluster sits around $1.3. This zone represents the most significant pool of leveraged positions on the chart. Price is currently above this level, placing the cluster as a strong target for downward movement.
The current structure suggests that XRP is operating in a defined range. The large cluster below is a potential magnet for price, while smaller clusters above could act as resistance if momentum builds upward. Traders can use these levels to anticipate short-term swings.
If XRP moves down, the $1.3 cluster becomes a primary target. A drop into this zone could trigger additional liquidations as leveraged positions are closed. Conversely, if the asset gains strength and rises above $1.5, the smaller upper clusters may attract new orders, pushing XRP toward $1.6 again.
Disclaimer: The content of this article solely reflects the author's opinion and does not represent the platform in any capacity. This article is not intended to serve as a reference for making investment decisions.
You may also like
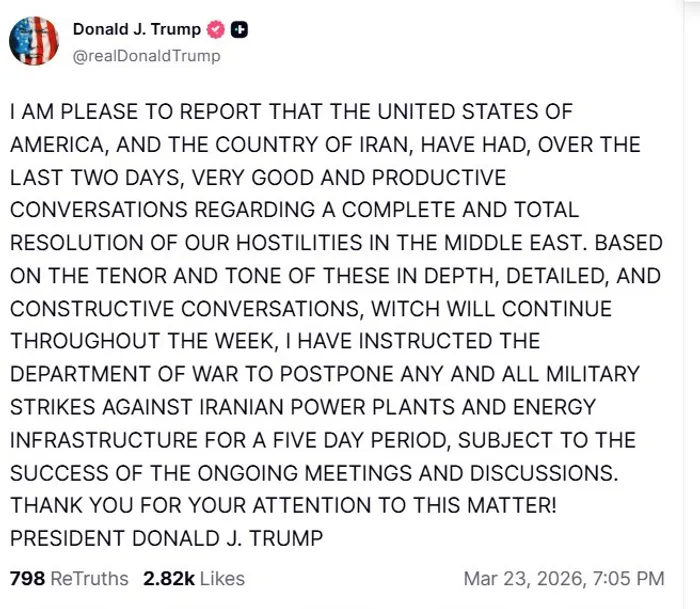
Nasdaq 100 Futures Jump 2% After Trump Postpones Iran Strikes, Signals 'Very Productive' Talks as Oil Tumbles
The $124 Trillion Shift in Wealth: Examining Corporate America's Leadership Succession Through Flow Analysis

Bitcoin's Macro Trap: Food Inflation and the Fragile Flow Setup