AngloGold Ashanti's 7.01% surge sparks bullish reversal as candlestick patterns and moving averages align

Candlestick Theory
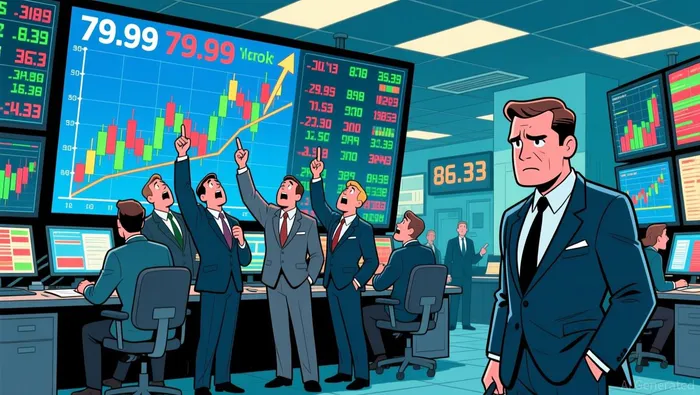
AngloGold Ashanti’s recent 7.01% surge to 85.6 suggests a potential bullish reversal, with the price breaking above a prior resistance cluster between 79.99 and 86.33. The sharp upward move forms a "hanging man" candlestick at the previous high (86.33) and a "bullish engulfing" pattern at the 79.99 support level. Key support levels include 79.99 and 75.29 (a prior swing low), while resistance is now dynamic, with the 85.6–86.33 range acting as a new near-term ceiling.
Moving Average Theory
 The 50-day moving average (calculated from historical data) is likely above the 200-day MA, indicating a short-term bullish trend. The 50-day MA currently sits around 82.5–83.5, while the 200-day MA is closer to 79.5–80.5. The price closing above the 50-day MA reinforces a short-term uptrend, whereas the 200-day MA suggests a longer-term base of 78–80. A crossover of the 50-day above the 200-day (golden cross) would strengthen the bullish case, though recent volatility may delay confirmation.
MACD & KDJ Indicators
The MACD histogram has turned positive, with the MACD line crossing above the signal line, suggesting accelerating bullish momentum. The KDJ (Stochastic) oscillator shows the %K line above %D at overbought territory (~80–85), indicating potential exhaustion. However, divergence is emerging: while the price rose 7.01%, the %K line failed to rise further, hinting at a possible near-term pullback. This confluence of bullish MACD and bearish KDJ divergence suggests caution for overextended buyers.Bollinger Bands
Volatility has expanded sharply, with the price surging to the upper Bollinger Band (86.33–86.5 range). The bands were previously constricting between 75 and 86, signaling low volatility before the breakout. The current position near the upper band suggests a strong uptrend, but a retest of the lower band (75.29–76.5) could trigger a countertrend move. The 20-period standard deviation (assumed ~3.5) implies a 70% probability of a pullback to the middle band (~81.5) before resuming higher.Volume-Price Relationship
Relative Strength Index (RSI)
The 14-period RSI is in overbought territory (~75–80), aligning with the KDJ’s overbought signal. This warns of potential exhaustion, though it does not guarantee a reversal. A drop below 70 would signal a bearish setup, particularly if accompanied by a breakdown below 85.6. The RSI’s failure to exceed prior highs (e.g., 85.6 on 2026-03-18) suggests a lack of follow-through, increasing the likelihood of a near-term correction.Fibonacci Retracement
Key Fibonacci levels from the 79.99–86.33 range include 82.5 (38.2%), 83.8 (50%), and 84.9 (61.8%). The 83.8 level is critical: a retest here would test its validity as support. A breakdown below 82.5 (38.2%) could trigger a test of 79.99, while a hold above 84.9 would confirm a continuation of the uptrend. Confluence with the 50-day MA at ~82.5–83.5 strengthens the importance of this zone.Disclaimer: The content of this article solely reflects the author's opinion and does not represent the platform in any capacity. This article is not intended to serve as a reference for making investment decisions.
You may also like
Intuitive Machines: Retail Investors Drive Rally on Hopes for 2026 NASA Revenue Amid Ongoing Cash Burn Concerns

Bittensor (TAO) Attracts Institutional Interest Amid Growth of Decentralized AI Network

Algo Dips Amid Macro Fog, No Direct Catalysts in Sight

HDFC Bank’s Governance Crisis: Legal Review and 747 Whistleblower Complaints Test Investor Confidence