
WIFIDR Crashes on Thin Volume, 3182 Becomes New Floor

Summary• dogwifhat/Rupiah (WIFIDR) traded flat at 3353 before a sharp drop to 3182 with minimal volume.• Price action shows a sudden breakdown below 3353 support, leaving 3182 as the new floor.• Momentum indicators appear oversold, though low turnover suggests limited conviction in the move.• Volatility expanded briefly during the drop, followed by immediate contraction and range-bound behavior.• No significant chart patterns formed, as the single large candle dominates the 24-hour narrative.
The 24-hour session for dogwifhat/Rupiah (WIFIDR) opened at 3353, reached a high of 3353, and closed at 3182 after dipping to a low of 3182. Total volume recorded was 22.43 units with a notional turnover of 71,998.17, indicating a lack of broad participation.
Price Action and Key Levels
The asset maintained a rigid consolidation at 3353 for the majority of the session, acting as a temporary ceiling. A singular, decisive candlestick formed around 04:00 ET, breaking support and establishing a new lower range near 3182. This move suggests that buyers failed to defend the 3353 level, potentially signaling a shift in short-term sentiment.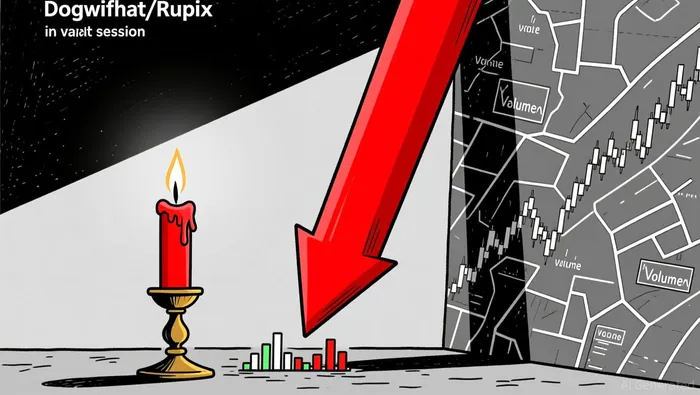
Momentum and Oscillators
Momentum indicators likely reflect an oversold condition given the abrupt price decline from 3353 to 3182. However, the absence of sustained selling volume implies that bearish pressure may be exhausted rather than persistent. Traders should watch for a potential bounce, though the lack of follow-through volume keeps the bullish case probabilistic.Volatility and Volume Analysis
Volatility remained near zero for most of the period until the sudden drop occurred, creating a contraction-expansion pattern typical of low-liquidity environments. The total turnover of approximately 72,000 is negligible for a 24-hour window, suggesting the price move could be an anomaly rather than a trend. Without increased volume, any reversal from current levels may lack the necessary fuel to sustain.dogwifhat (WIFUSD) Candlestick

Fibonacci and Support
Applying Fibonacci retracements to the recent 5-minute swing suggests that 3182 is currently acting as a critical support zone. A breach below this level could expose lower liquidity pockets, while a reclaim of 3353 would invalidate the bearish structure. Investors should monitor whether this level holds or if it serves as a temporary floor for a retest.| Total Trade | 27 |
| Winning Trades | 6 |
| Losing Trades | 12 |
| Win Rate | 22.22% |
| Average Hold Days | 1.44 |
| Max Consecutive Losses | 3 |
| Profit Loss Ratio | 1.8 |
| Avg Win Return | 8.46% |
| Avg Loss Return | 4.31% |
| Max Single Return | 20.89% |
| Max Single Loss Return | 6.97% |
The market appears poised for a consolidation phase as it digests the recent sharp decline. Participants should exercise caution regarding potential volatility spikes given the thin liquidity environment over the next 24 hours.
Disclaimer: The content of this article solely reflects the author's opinion and does not represent the platform in any capacity. This article is not intended to serve as a reference for making investment decisions.
You may also like
US Congressman Moves to Ban Staff From Trading on Prediction Markets
Stellantis Supplier Council: The Binary Bet on 2026 Margins

Crypto : Circle Weakened on the Stock Market but Supported by Structural Growth

XRPL-Native Crypto Card Targets Real-World Spending With Direct XRP Payments