Gold price insights for April 1 – essential intraday entry points for active traders

Gold Futures 5-Minute Chart: A Powerful Tool for Traders
If you actively trade gold futures throughout the day, the 5-minute bar chart for Comex gold offers a practical way to analyze market movements. This chart highlights important short-term support and resistance levels, helping you pinpoint possible entry and exit prices for buying and selling. Successful traders often capitalize on early signs of price strength to buy and act quickly on initial weakness to sell.

Explore this unique chart to enhance your trading strategies and stay ahead in the gold futures market.
Disclaimer: The content of this article solely reflects the author's opinion and does not represent the platform in any capacity. This article is not intended to serve as a reference for making investment decisions.
You may also like
Dogecoin Whales Hit All-Time High Accumulation as Bullish Momentum Ignites
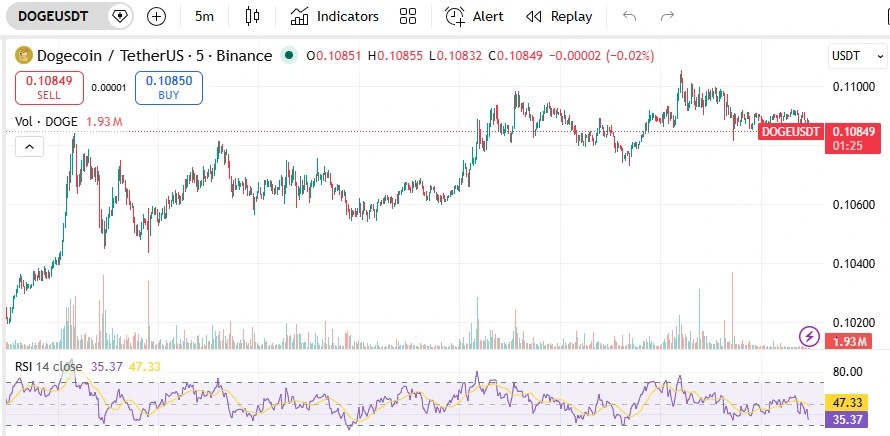
Dogecoin’s $0.104 flip: Bullish milestone or a high-stakes bull trap?

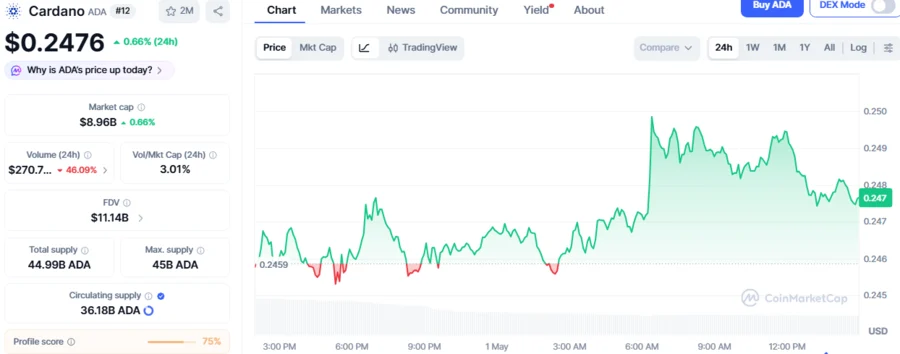
ADA Whale Accumulation Reaches $10M Amid Repeated Bullish Pattern Signaling Imminent 507% Breakout
ZCash rallies 5% in a day, but weekly trading volume slows: What comes next?