
Gold-Silver Ratio V-shaped Rebound: Silver Plummets 13% in Two Days, What Is the Market Fearful Of?

I. Why Did Silver Plunge From Its Highs?
In just two days, silver plummeted from $87.55 to $75.99, a sharp decline of 13.2%. Meanwhile, the gold/silver ratio surged from 53.6 to 59.75. Previously, the market expected gold to catch up, thus restoring the ratio, but in reality, silver itself carried out this brutal mean reversion.
This was a stampede caused by the resonance of multiple bearish factors:
First, India’s tariff “nuclear bomb.” India raised import tariffs on gold and silver from 6% to 15% in one go, directly hitting the physical consumption side. As one of the world’s largest silver consumers, demand expectations in India suddenly weakened.
Second, macro pressure across the board. The US April CPI came in at 3.8% year-over-year (higher than expected), and PPI saw its biggest month-on-month rise in four years. The 30-year US Treasury yield broke above 5.1% and the dollar index kept strengthening. With newly appointed Federal Reserve Chairman Walsh confirmed, the market worries about the continuation of hawkish policy, with rate expectations surging and zero-yield assets taking the brunt.
Third, panic over liquidity triggered by Asia-Pacific stock market trading halts. On May 15, South Korea’s KOSPI plunged 6.12%, triggering a circuit breaker; Japan’s Nikkei dropped 2% in tandem, sparking panic selling of risk assets worldwide. Under margin call pressure, investors were forced to sell off silver and other highly liquid commodities to meet margin requirements—the dual industrial and financial nature of silver became a disaster at this moment.
II. Gold/Silver Ratio Technical Analysis: Rebound Does Not Change Downward Trend
The rebound of the gold/silver ratio from 53.6 to 59.75 seems fierce, but in the medium term, this is merely a technical correction within the ongoing downtrend.
Trendline resistance: Since the gold/silver ratio fell from 110 in 2025, a long-term descending trendline has continued to suppress the peaks of each rebound. This trendline now lies in the 65-70 region, overlapping with the daily MA60 (about 62.5), forming dual resistance. This means the upside risk for the gold/silver ratio is limited, with 60-62 being a key resistance test zone.
Moving averages: On the daily chart, although the gold/silver ratio has seen a V-shaped rebound, it is still under pressure below the MA20 (about 58.8) and MA60 (about 62.5).
MACD pattern: On the daily chart, after a death cross of the MACD below the zero axis, although the fast line has turned up, the histogram remains green (bearish momentum) and both DIF and DEA remain below zero—this is a weak rebound within a bearish trend. Only when a bullish MACD crossover occurs and the histogram turns red can a trend-level reversal signal be confirmed. The weekly MACD remains in a death cross below zero with increasing volumes, confirming the medium-term bearish trend.
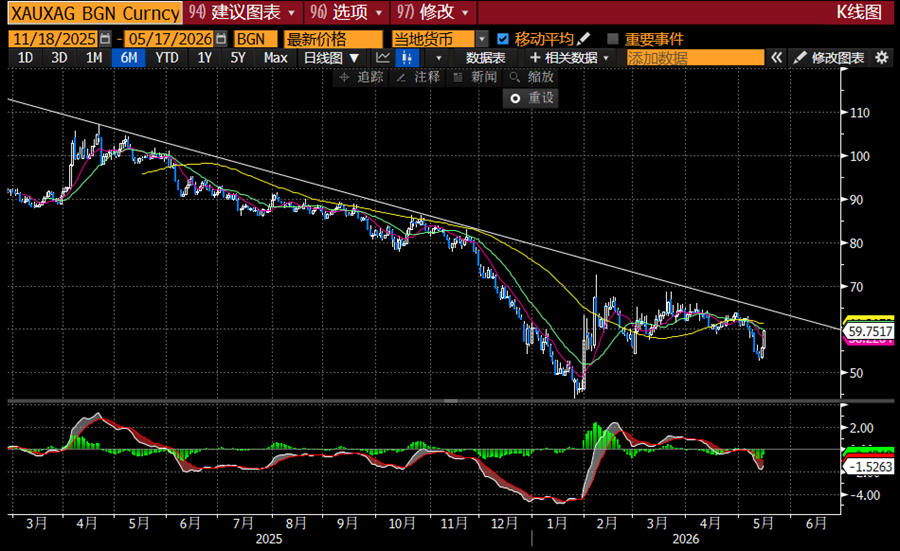
In summary, the V-shaped rebound in the gold/silver ratio is more of an oversold correction within a bearish trend rather than a bottom reversal. The upper trendline and the moving averages form dual resistance, limiting the rebound space. If the ratio faces resistance and falls back from the 60-62 area, it will be a good opportunity to follow the trend and short, with targets at 55 or even the previous low of 53.
III. Is Gold’s Resilience Still Reliable?
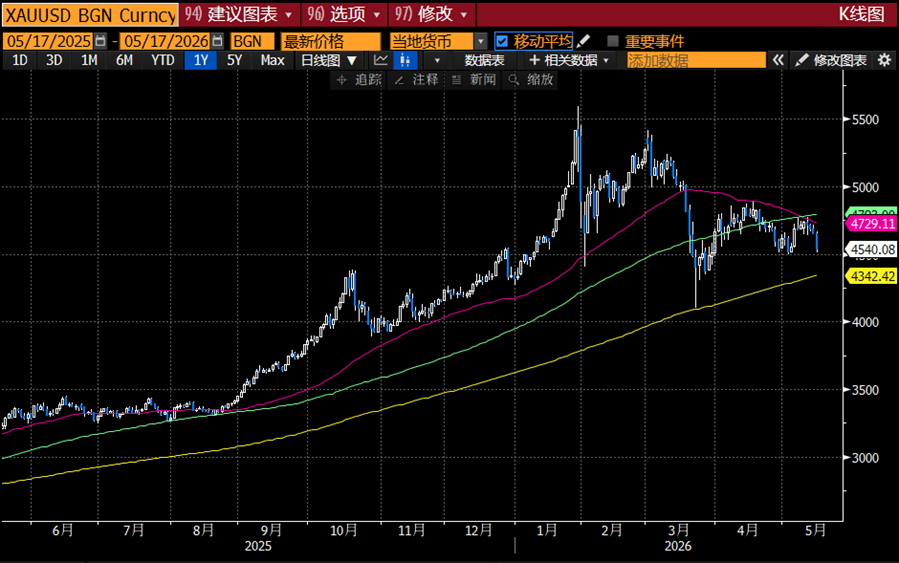
Gold dropped from $4,736 to $4,540, a decline of 4.1%, which is relatively resilient compared to silver’s crash. The support logic remains intact: global central banks continue to increase gold holdings, with total positions reaching a record high of 38,700 tons; Middle East geopolitical risks persist; actual interest rates remain under pressure amid stagflation. Technically, the $4,500–$4,550 region has dense previous trading support; if this area holds, the case for a gold catch-up rally remains. However, the unfavorable signal is that the 50-day moving average has crossed below the 100-day, suggesting medium-term upside for gold may face some challenges.
IV. Outlook and Trading Strategy
For the gold/silver ratio, the medium- to long-term downward structural trend remains unchanged. In terms of trading strategy, the 60-62 zone on any rebound is a key observation window: if the ratio can break through 62.5 with volume (where trendline and MA60 overlap), the rebound could expand towards 65-68; if it is resisted and falls back, this will verify a continuation bearish pattern, and short positions can be taken with targets at 55-53.
Overall, shorting the gold/silver ratio on rebounds remains in line with the broader trend. As for gold, watch the key support area around 4,500—if it fails to hold, the price is likely to fall towards the 200-day moving average near 4,350.
Disclaimer: The content of this article solely reflects the author's opinion and does not represent the platform in any capacity. This article is not intended to serve as a reference for making investment decisions.
You may also like
Key Data Released Ahead of Jackson Hole: U.S. July PCE Stuck at 3.7%, Q2 GDP Remains Unrevised at 1.5%, Consumer Spending Revised Upward but Stagnates in July
The Federal Reserve's most closely watched inflation indicator—the Personal Consumption Expenditures (PCE) Price Index—unexpectedly stabilized in July. The second estimate of the U.S. second-quarter GDP, released on the same day, maintained an annualized growth rate of 1.5%, but both consumer spending and business investment were revised upward from the initial figures. However, actual consumer spending in July was flat month-over-month, indicating that the economy cooled after strong growth earlier in the summer.

Bitcoin returns to $80,000, but MSCI wields its sword again! The financing flywheel that Strategy (MSTR.US) prides itself on faces a "benchmark identity trial"
Due to Strategy Inc. holding a large amount of bitcoin, MSCI is considering formulating relevant rules and may remove it from the global stock indices. The proposal would exclude companies that MSCI deems primarily engaged in asset accumulation rather than operating businesses.

Disappointing guidance leads to sharp stock decline! Zoom (ZM.US) enterprise segment remains strong but can't mask overall weakness, Wall Street opinions diverge
Video communications platform Zoom (ZM.US) saw its share price drop by about 7% in pre-market trading on Wednesday after the company issued guidance that fell short of expectations, disappointing investors who had hoped for more.

Consumption among Middle- and Low-Income Groups Continues to Decline! US Packaged Food Giant Smucker (SJM.US) Reaches Positive Cash Flow and Raises Full-Year Outlook
The company’s "revenue and profit both exceeded expectations" and it unexpectedly raised its performance guidance, driving its stock price to surge by more than 10% in U.S. pre-market trading.

Crypto prices
More


