
A Chart Overview of Commodity Support and Resistance: Gold, Silver, Oil, Gas + Platinum, Palladium, Copper, Agricultural Futures (July 3, 2026)

Huitong Finance July 3 ——— An overview chart of commodity support and resistance: gold, silver, oil, gas + platinum, palladium, copper + agricultural futures, updated at 07:20 on Friday, July 3, 2026 (UTC+8), specifically covering 14 varieties including gold, silver, platinum, palladium, copper + crude oil, natural gas, fuel oil + wheat, corn, and cotton. For more details, refer to the special chart produced by Huitong Finance Analyzer.
An overview chart of commodity support and resistance: gold, silver, oil, gas + platinum, palladium, copper + agricultural futures, updated at 07:20 on Friday, July 3, 2026 (UTC+8), specifically covering 14 varieties including gold, silver, platinum, palladium, copper + crude oil, natural gas, fuel oil + wheat, corn, and cotton. For more details, refer to the special chart produced by Huitong Finance Analyzer.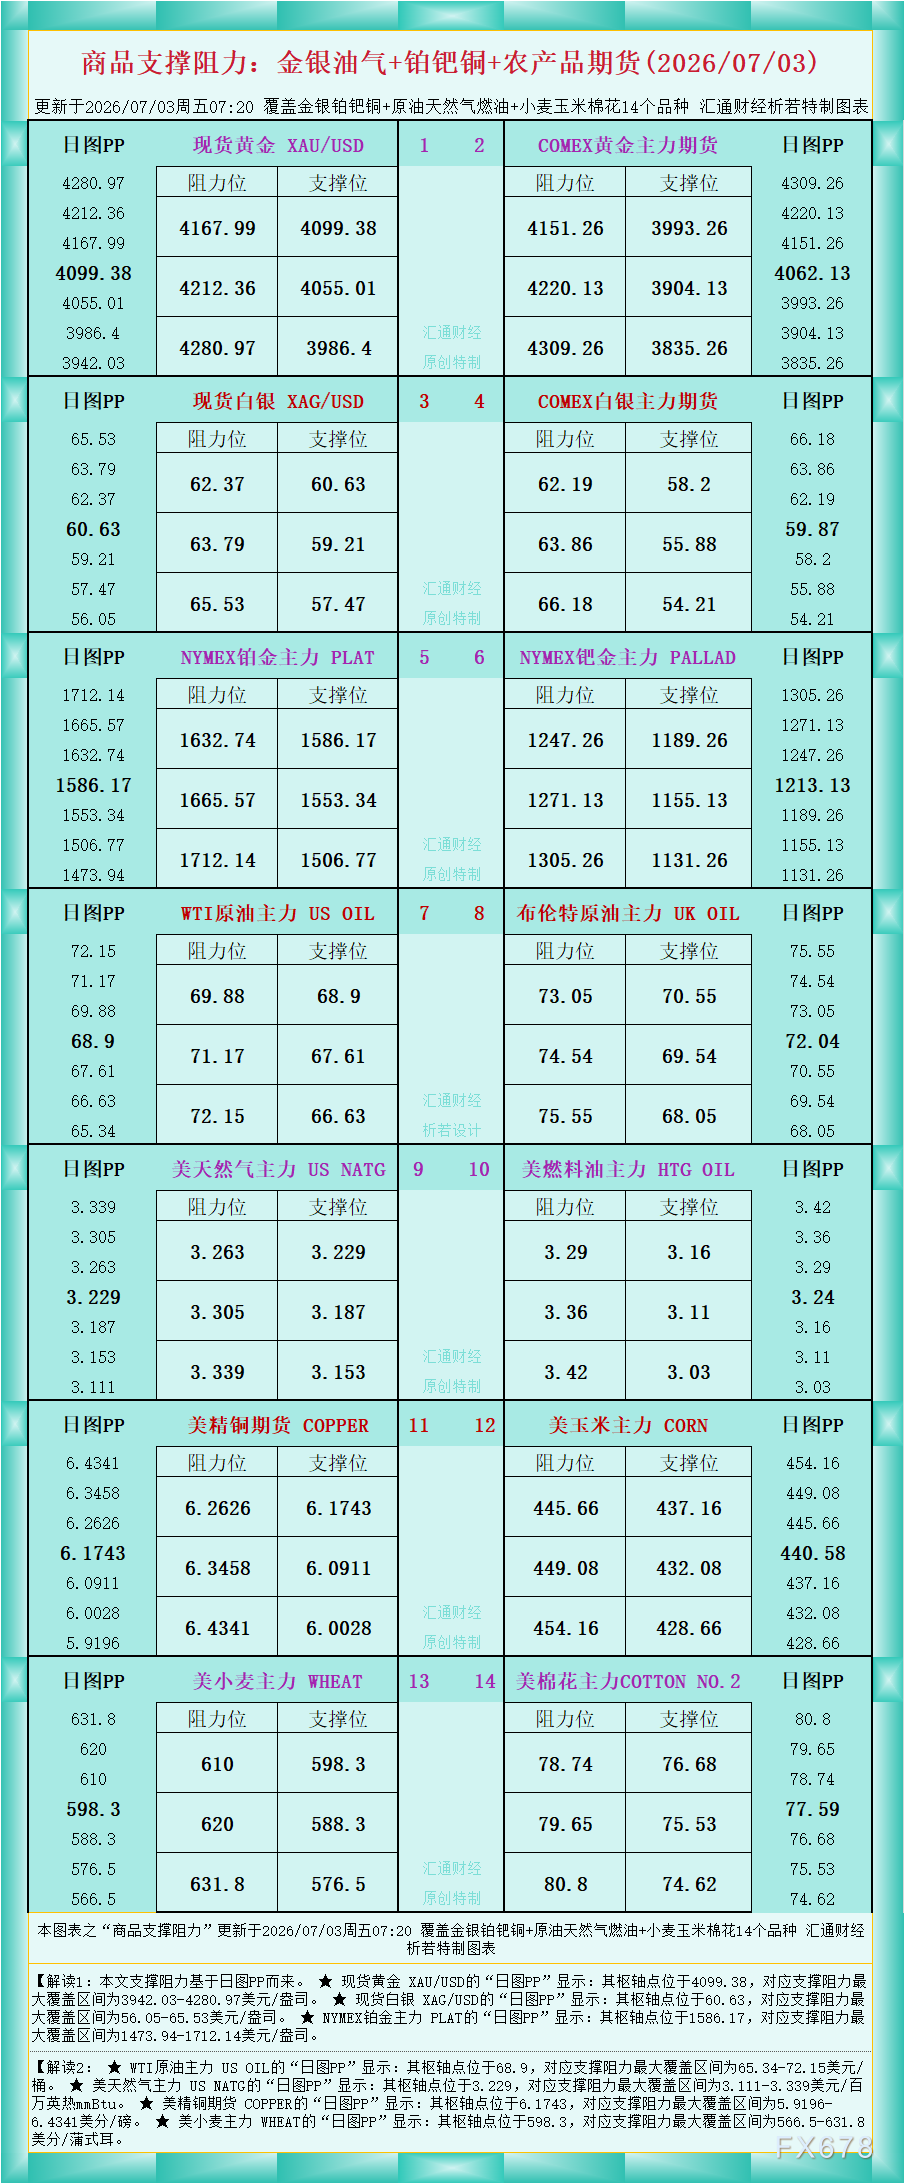
According to the chart data, Interpretation 1: The support and resistance levels in this article are based on daily chart PP.
★ The daily chart PP for spot gold XAU/USD shows: the pivot point is at 4099.38, with the maximum support and resistance range between $3942.03-$4280.97/oz.
★ The daily chart PP for spot silver XAG/USD shows: the pivot point is at 60.63, with the maximum support and resistance range between $56.05-$65.53/oz.
★ The daily chart PP for NYMEX platinum main contract PLAT shows: the pivot point is at 1586.17, with the maximum support and resistance range between $1473.94-$1712.14/oz.
Interpretation 2:
★ The daily chart PP for WTI crude oil main contract US OIL shows: the pivot point is at 68.9, with the maximum support and resistance range between $65.34-$72.15/barrel.
★ The daily chart PP for US natural gas main contract US NATG shows: the pivot point is at 3.229, with the maximum support and resistance range between $3.111-$3.339 per million British thermal units (mmBtu).
★ The daily chart PP for US copper futures COPPER shows: the pivot point is at 6.1743, with the maximum support and resistance range between 5.9196-6.4341 cents/pound.
★ The daily chart PP for US wheat main contract WHEAT shows: the pivot point is at 598.3, with the maximum support and resistance range between 566.5-631.8 cents/bushel.
For more product interpretations, see the chart.
Disclaimer: The content of this article solely reflects the author's opinion and does not represent the platform in any capacity. This article is not intended to serve as a reference for making investment decisions.
You may also like
Australian Dollar weakens against Japanese Yen as chances of RBA rate hikes fall
24 Hour Crypto Recap: Here’s What Happened in the Market
Pi Network Begins Ninth Protocol Upgrade Ahead of Final Version 27
India Gold price today: Gold falls, according to FXStreet data
Crypto prices
More


