Bitget App
Trade smarter
Buy cryptoMarketsTradeFuturesStocksEarnInstitutionAI & More
DeXe slips 13% – But here’s why the pullback may be temporary

DeXe slips 13% – But here’s why the pullback may be temporary

AMBCryptoAMBCrypto2026/07/14 16:03
By:AMBCrypto

DeXe [DEXE] has been printing fresh highs for weeks, gaining 45% in the past seven days alone and more than 1,000% across the past 180 days, as reflected on the chart.

Over the past 24 hours, capital has begun retreating as buyers step back and lock in profit, a shift that has dragged the asset down roughly 13% within the period.

The chart structure, however, points to a possible temporary pullback, with price still positioned to extend its upside over the longer term.

@media only screen and (min-width: 0px) and (min-height: 0px) { div[id^="bsa-zone_1774359638628-7_123456"] { min-height: 50px; transition: min-height 0.3s ease; } } @media only screen and (min-width: 640px) and (min-height: 0px) { div[id^="bsa-zone_1774359638628-7_123456"] { min-height: 90px; } }
AD

DeXe doji candles expose a standoff

DeXe printed two telling doji candles in the early hours of the day.

The first, a gravestone doji, reflected intense sell pressure as price attempted to extend its upswing, while a dragonfly doji formed a few candles later and signaled bulls stepping back in.

Price currently sits decidedly bearish, and the near-term outcome hinges on the key demand zones mapped on the chart.
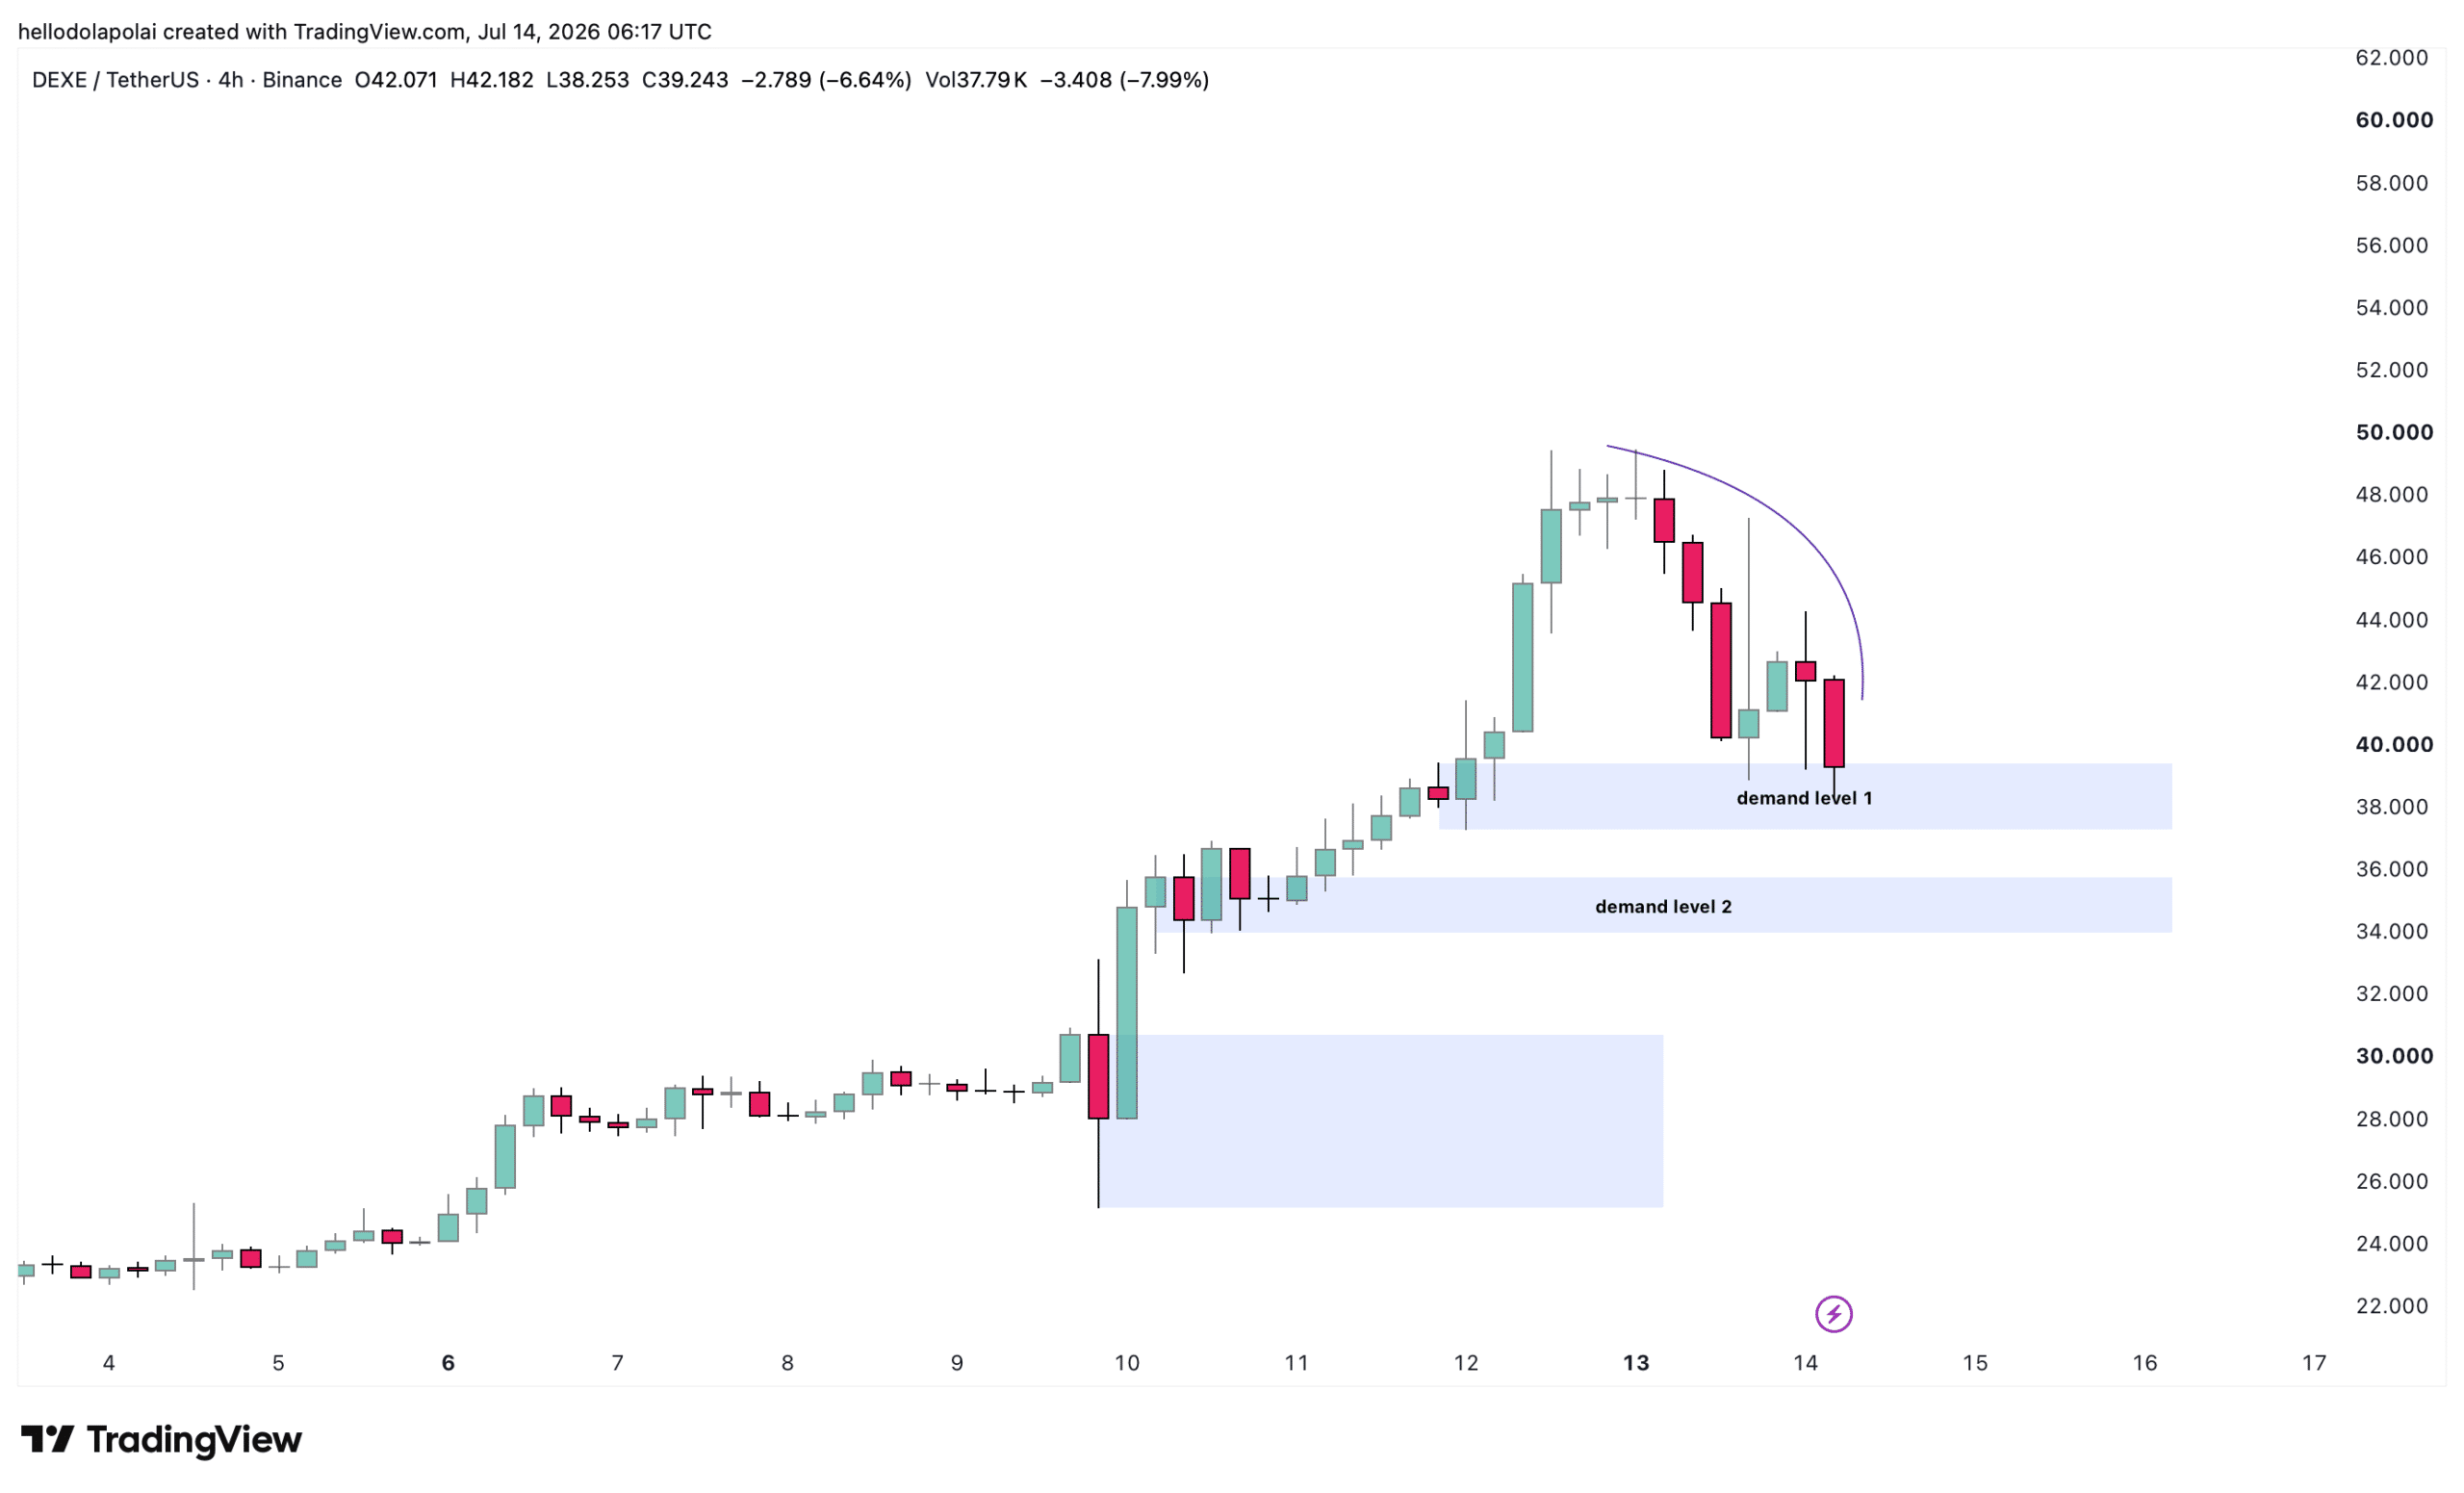
DeXe slips 13% – But here’s why the pullback may be temporary image 0 Source: TradingView

Demand zone 1 offers the first line of support, and a sufficient bounce there could send price swinging upward to clear the overhead liquidity marked by the curved line on the left.

Should selling pressure keep mounting and that level give way, demand zone 2 stands ready to cushion price and absorb the pressure that has weighed on the asset for most of the day.

Demand zone 1 holding remains the likelier scenario, and volume data supports that read, with volume down 36% over the period.

Declining volume alongside a falling price often signals that the momentum driving the move is weak, which opens room for buyers to take control.

Indicators point to a slowdown rather than a reversal

Momentum indicators aren’t fully aligned with the bearish price action, and the Accumulation/Distribution (A/D) indicator captures that tension.

The A/D line weights each period’s volume by where price closes within its range, serving as a proxy for whether an asset is being accumulated or distributed.

At the time of this report, it was trending slightly upward even as prices fell, a divergence that suggests a modest step-up in buyer activity within the period.
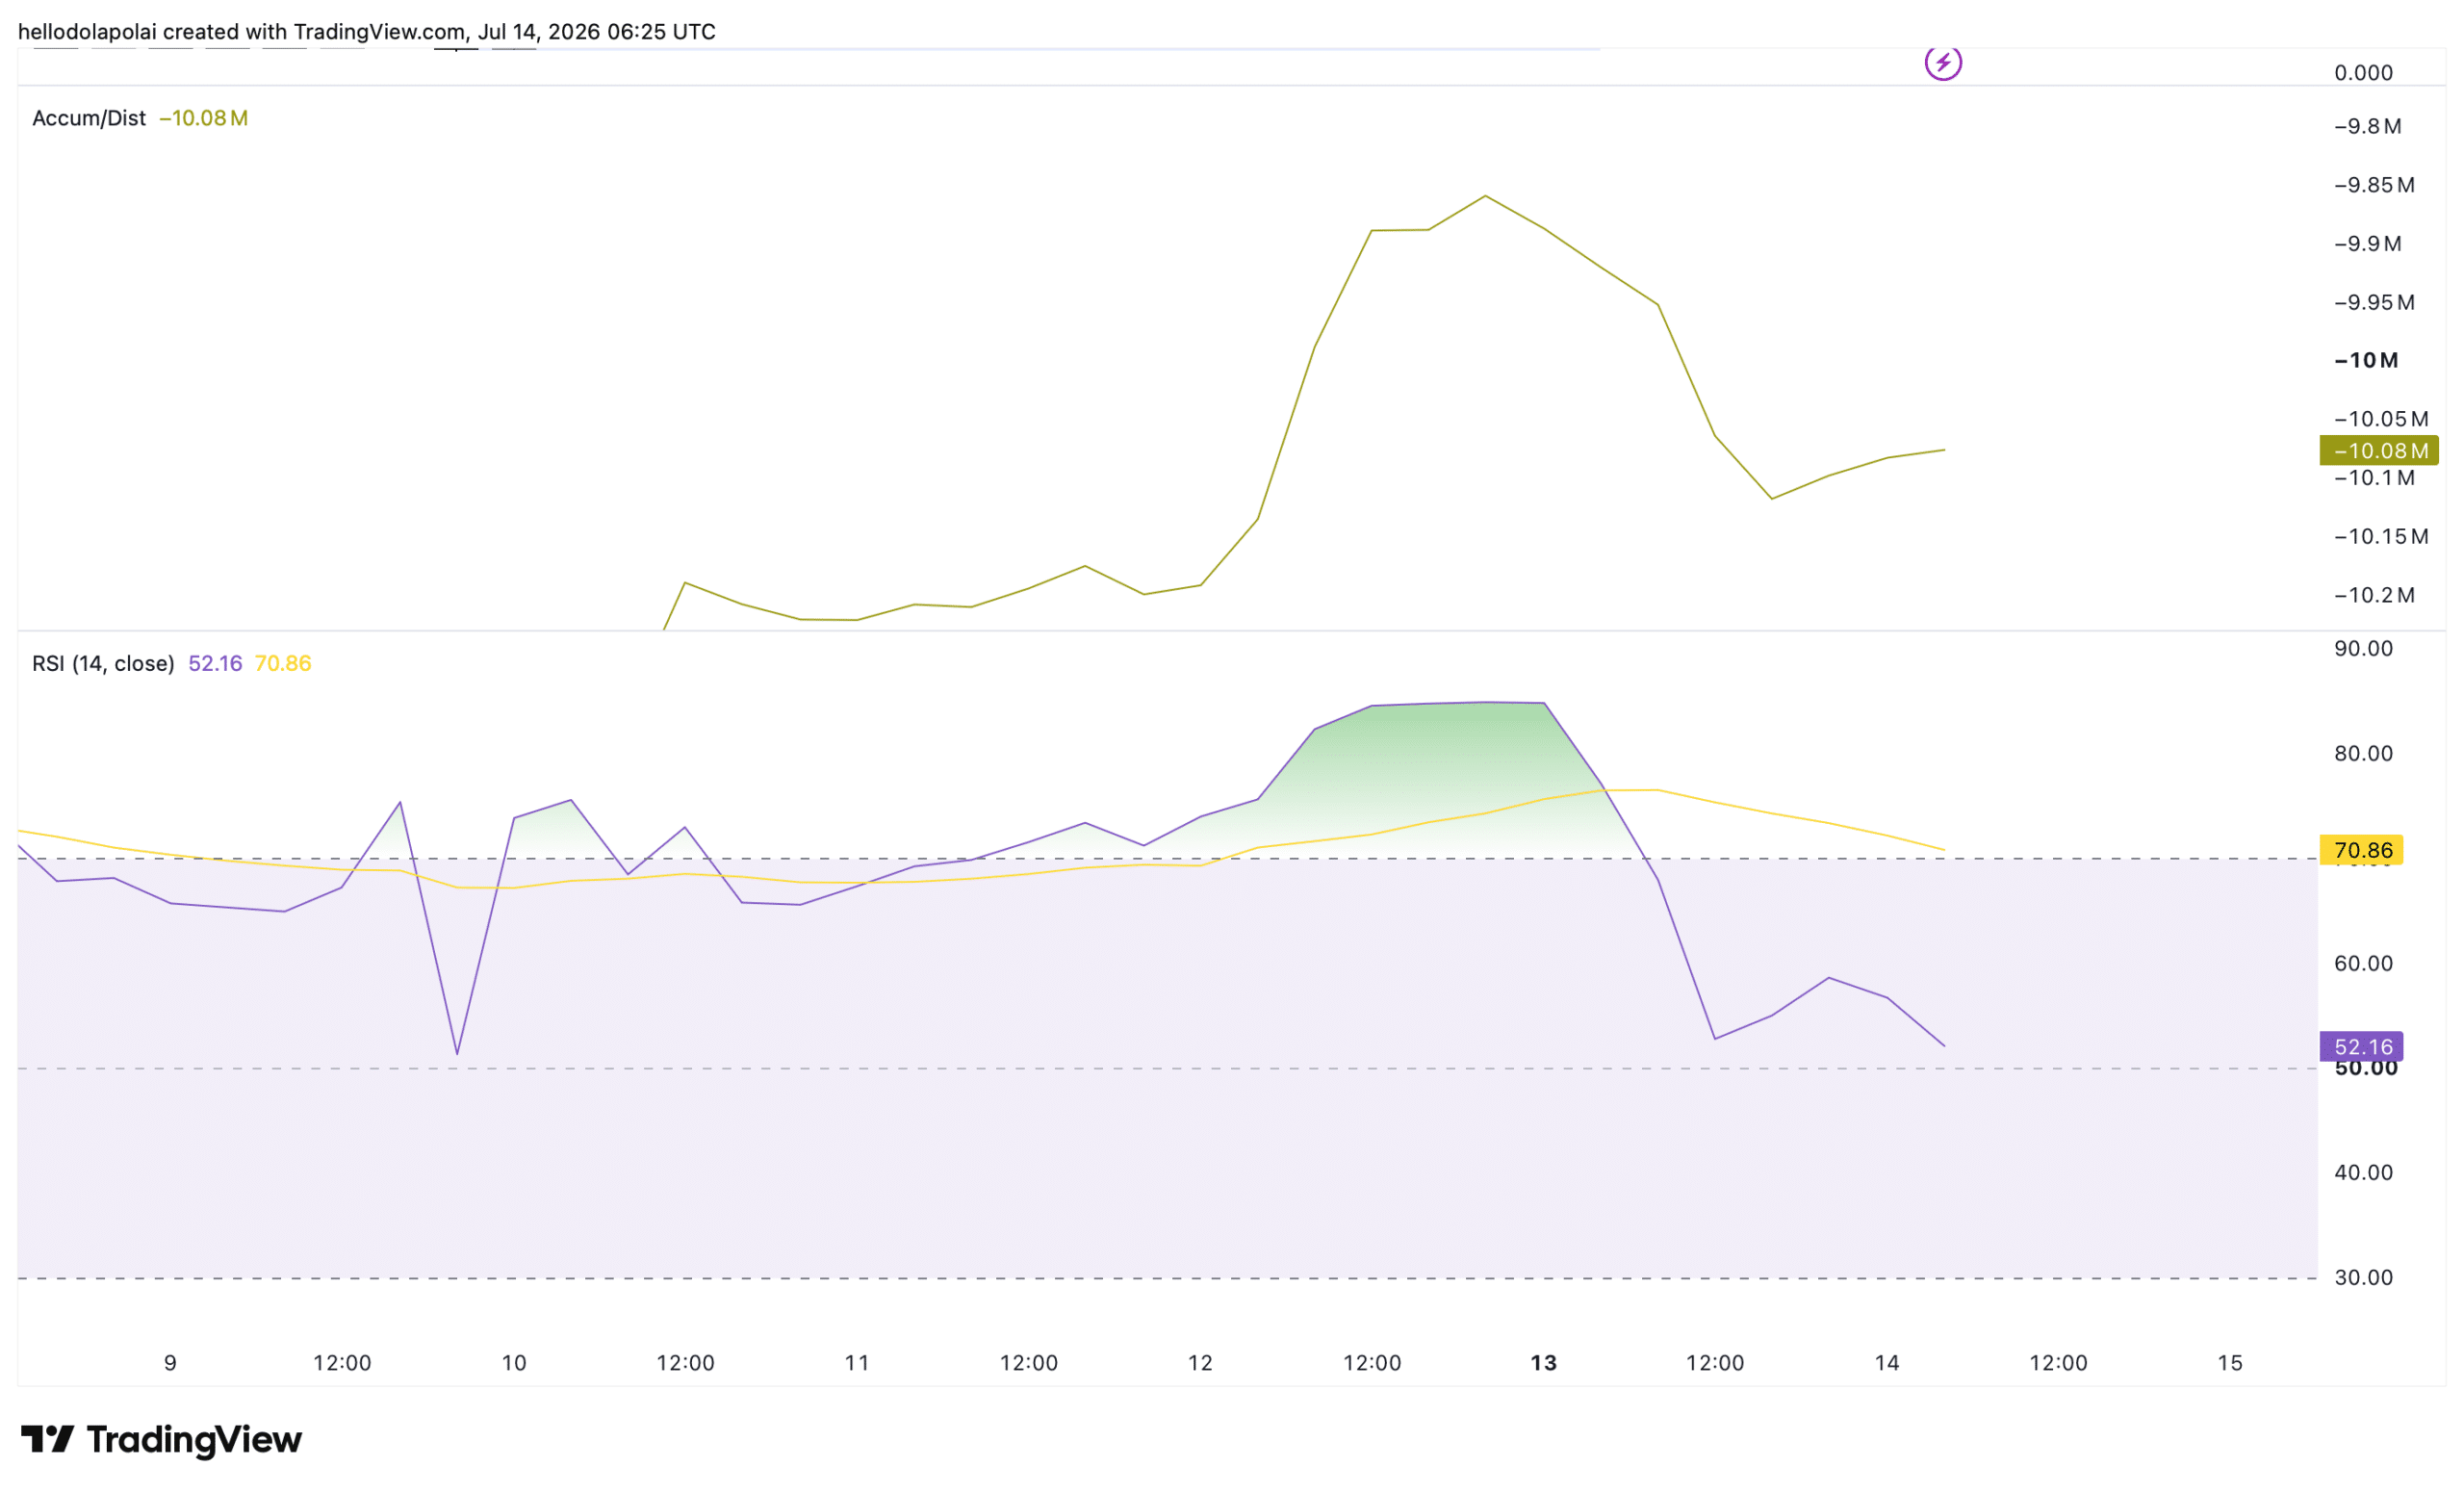
DeXe slips 13% – But here’s why the pullback may be temporary image 1 Source: TradingView

Likewise, the relative strength index (RSI) is holding within the bullish 50 to 70 band at a reading of 52.

The RSI measures the speed and magnitude of recent price moves, and a reading sitting right on the midline points to neutral, relaxed sentiment rather than a decisive bearish shift.

The balance suggests the price is likely to settle around this level, which coincides with the demand zone.

Sell pressure eases across the Spot market

Spot market data points to easing sell pressure so far. Spot netflow hit its highest net sales on the 12th of July as sellers dominated and net inflows reached $5.38 million.

Although sellers still hold the upper hand, the netflow has plunged to just $391,000, more than ten times below the earlier reading.
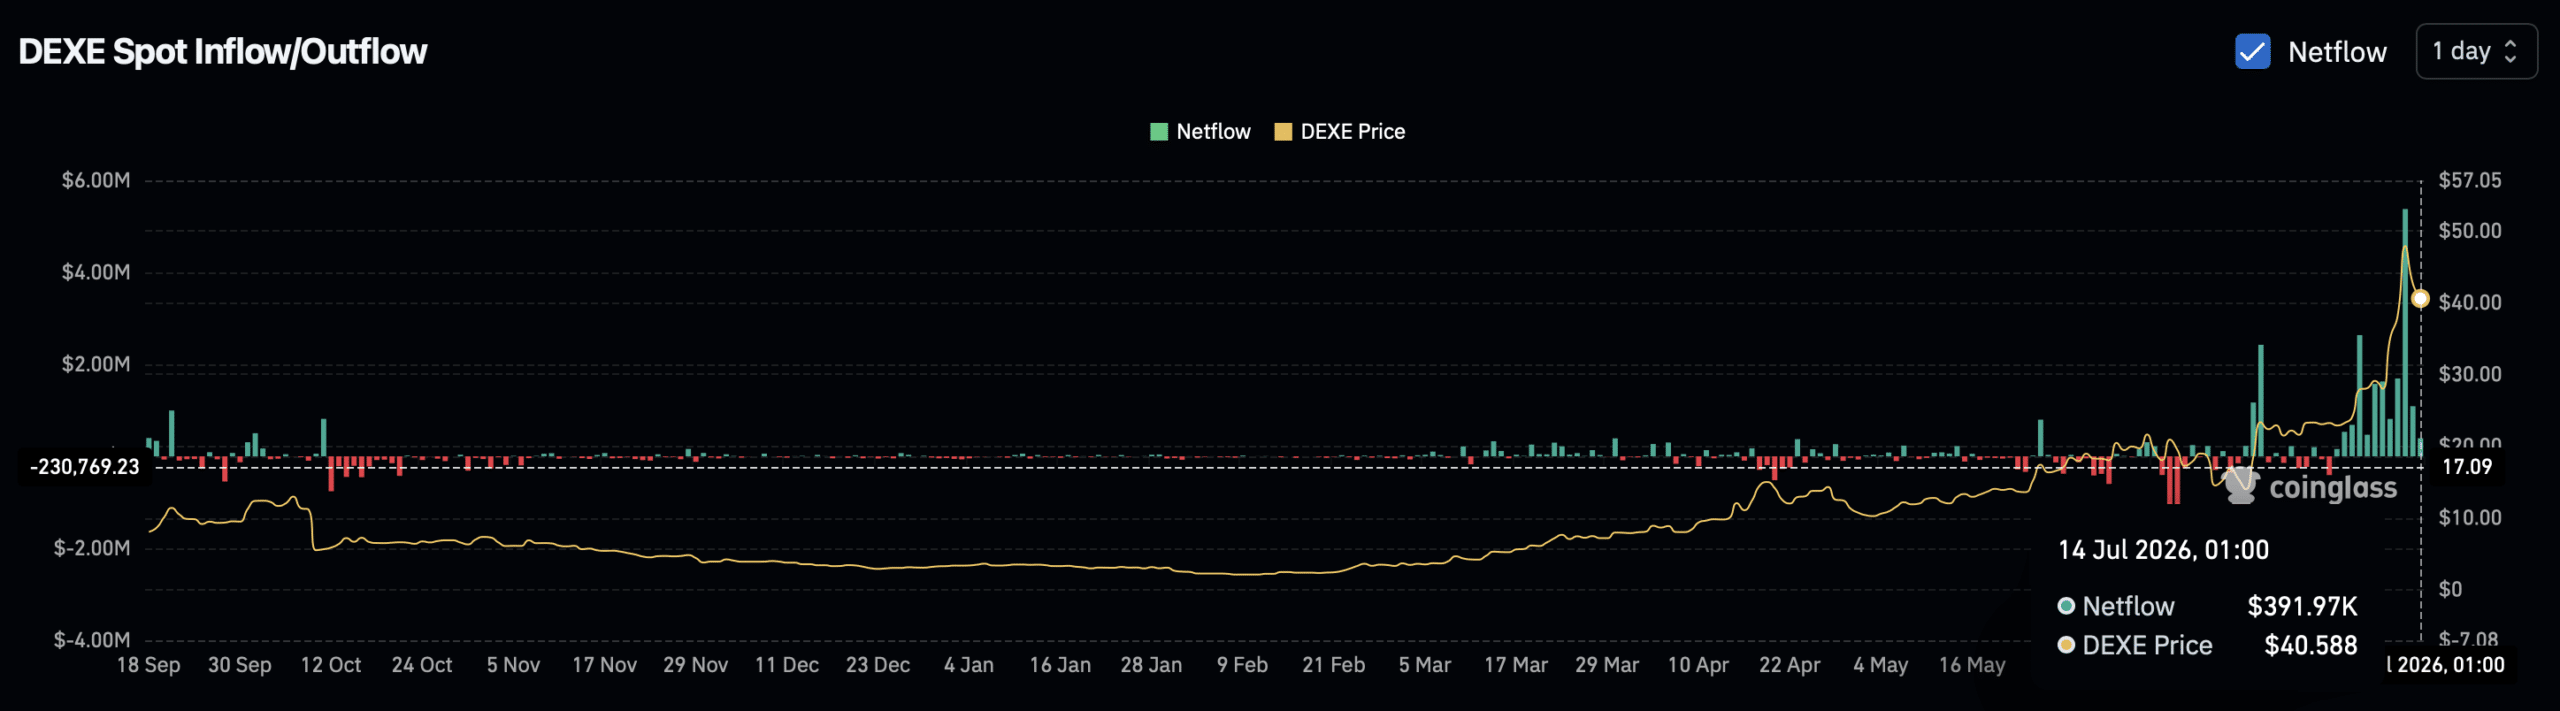
DeXe slips 13% – But here’s why the pullback may be temporary image 2 Source: CoinGlass

This matters because it shows seller strength has weakened sharply on a netflow basis while buyers step in.

Final Summary

  • DeXe has surged more than 1,000% over the past six months, and the current 13% dip looks more like profit-taking after a strong run than a shift in trend.
  • Selling has cooled sharply over the last day, with net sales down more than tenfold from the July 12 peak, a sign that buyers may be stepping back in.
0
0

Disclaimer: The content of this article solely reflects the author's opinion and does not represent the platform in any capacity. This article is not intended to serve as a reference for making investment decisions.

Understand the market, then trade.
Bitget offers one-stop trading for cryptocurrencies, stocks, and gold.
Trade now!

You may also like

Unlike Elon Musk’s “One Price” Approach: Anthropic (ANT.US) Roadshow Pricing Inquiry at $70-78, Institutional Investors Become the True Decision Makers in IPO Pricing

Anthropic will launch what is set to be the largest IPO in history next week, aiming to take this title from SpaceX. However, unlike Elon Musk’s conglomerate, large investors will have greater influence over its IPO pricing amid the ongoing turbulence in the artificial intelligence (AI) market.

智通财经•2026/11/14 00:01

Both are Tech Giant IPOs, Why is Anthropic's Listing Valuation More Conservative Than SpaceX?

Unlike SpaceX's fixed pricing model, Anthropic adopts the traditional roadshow approach, granting more pricing power to institutional investors. Due to factors such as the Nasdaq downturn, Federal Reserve rate hikes, and AI oversupply, the market environment is under pressure, and previous expectations for a $2 trillion valuation have faded. Analysts point out that the difference in pricing strategies between the two companies essentially reflects the depth of their relationships with the Wall Street capital markets.

华尔街见闻•2026/11/13 23:51
Both are Tech Giant IPOs, Why is Anthropic's Listing Valuation More Conservative Than SpaceX?

Inflation Pressures Persist, Fed Rate Hike Expectations Intensify, AI Investment Risks Increase Financial Stability Concerns

As U.S. inflation accelerates again, Federal Reserve officials have intensively released hawkish signals this week, further strengthening market expectations for a rate hike in December and opening the door to another rate hike in January next year.

智通财经•2026/11/13 23:47
Inflation Pressures Persist, Fed Rate Hike Expectations Intensify, AI Investment Risks Increase Financial Stability Concerns

Barclays Turns Tactically Bullish on US Stocks for the First Time Since March, Recent Selloff Sets Stage for Short-Term Rebound

As investors significantly reduce their stock holdings and market volatility pressures ease, Barclays' trading division has turned tactically bullish on US equities for the first time since mid-March this year.

智通财经•2026/11/13 23:47
Barclays Turns Tactically Bullish on US Stocks for the First Time Since March, Recent Selloff Sets Stage for Short-Term Rebound