
INVO Fertility, Inc. Stock Reverses From $2.80 High as RSI Hits 82

INVO Fertility, Inc. stock is moving through one of its most volatile stretches in recent memory. Price spiked to $2.80 intraday before reversing hard to close at $2.03, just above the session low of $1.95. That rejection from the highs suggests the rally may be running out of room.
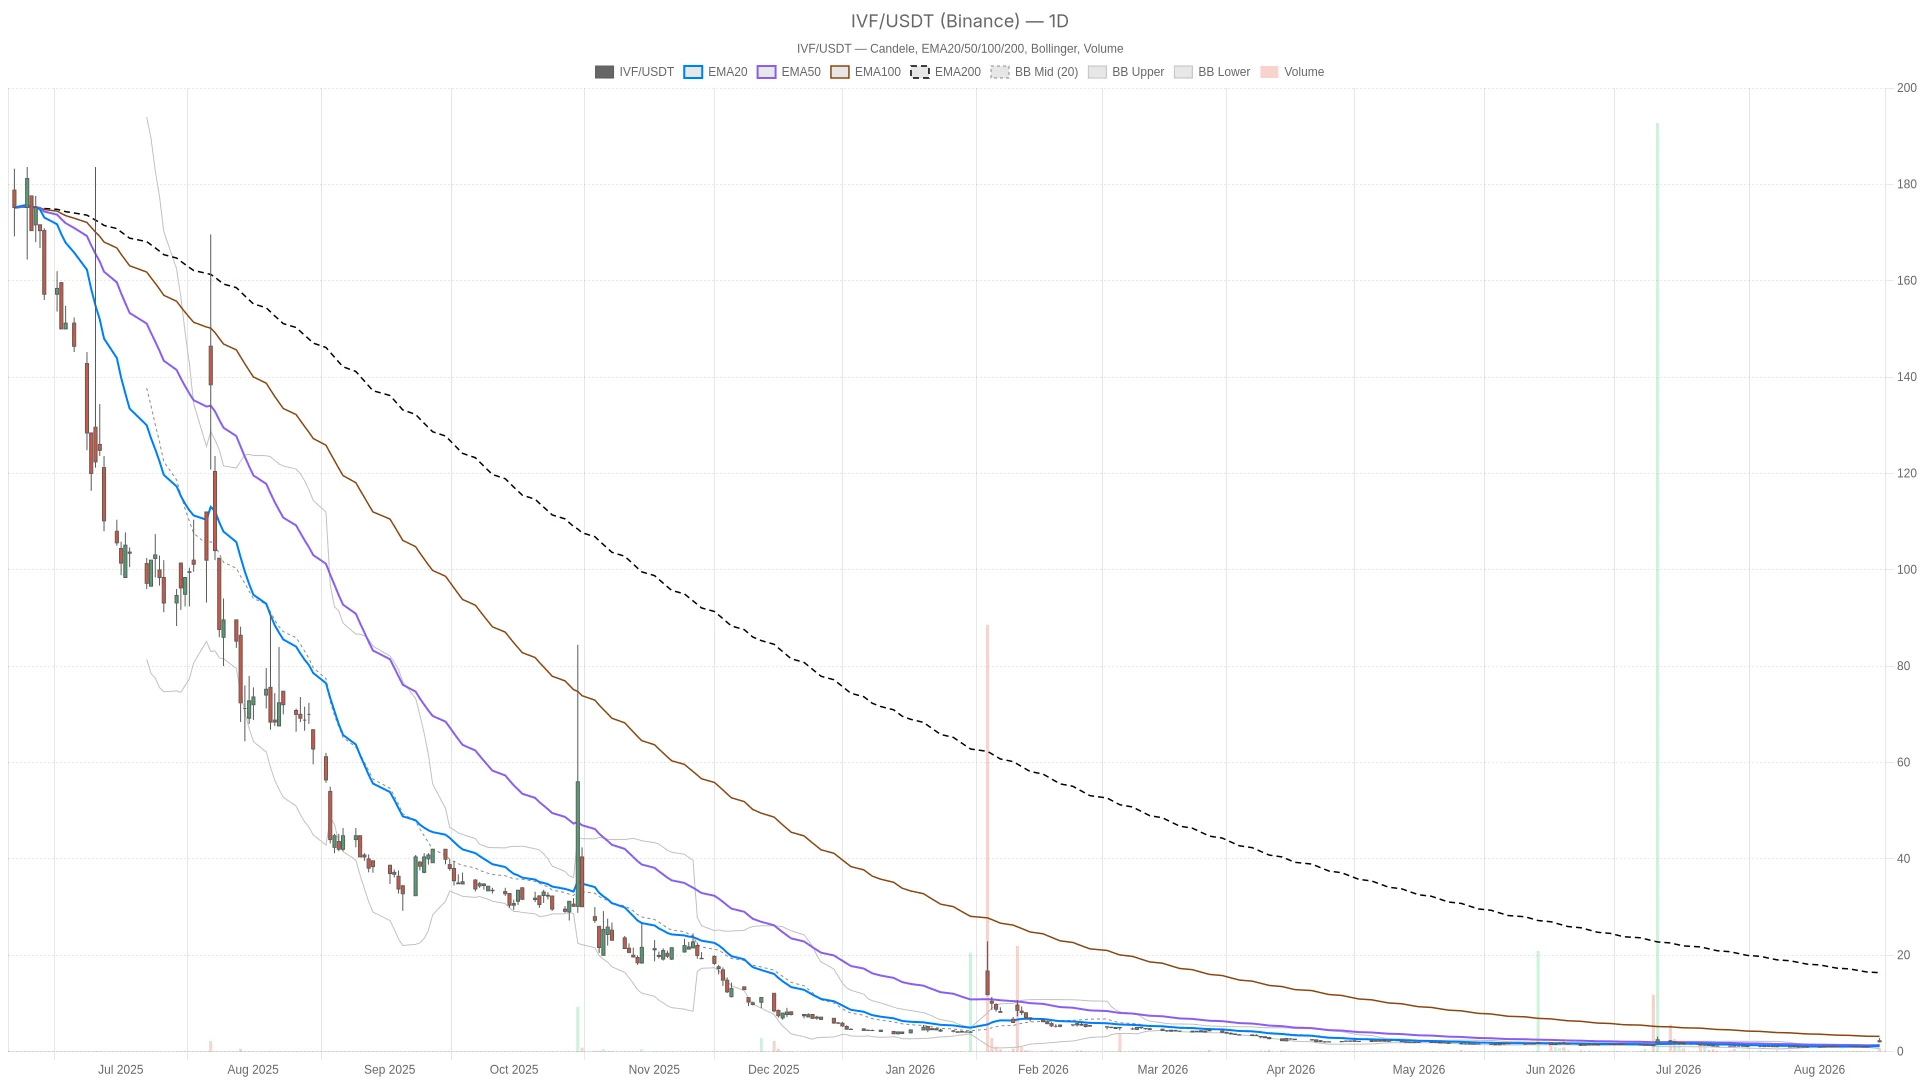 IVF — daily chart with candlesticks, EMA20/EMA50 and volume.
Summary
Key takeaways
- INVO Fertility, Inc. stock reversed from a $2.80 intraday high to close at $2.03, just above the $1.95 session low.
- Daily RSI14 sits at 78.69 and hourly RSI14 reads 82.66, both deep in overbought territory.
- Price trades well above the daily Bollinger upper band of 1.51 and the daily EMA20 of 1.14.
- Daily support sits at 1.72 and resistance at 2.57; a close below support would signal the spike has failed.
- The daily EMA200 at 16.38 keeps the stock inside a much larger long-term downtrend.
INVO Fertility, Inc. Stock: Daily Trend and Momentum Under Pressure
The daily picture is genuinely mixed. Momentum remains positive, but price is stretched far beyond its short-term averages. RSI14 sits at 78.69, deep into overbought territory. MACD stays positive, with a histogram reading of 0.08, confirming upward momentum.
Overbought Extension Above the Bands
However, price trades well above the daily Bollinger upper band of 1.51 against a midline of 1.05. That extension typically signals an overheated move rather than a sustainable trend.
Short-Term Strength Versus Long-Term Downtrend
The daily EMA structure adds another layer of complexity. EMA20 (1.14) and EMA50 (1.34) sit far below the current price of 2.03. This confirms the strength of the recent short-term surge. In contrast, EMA200 stands at 16.38, a reminder that the stock remains deep within a much larger downtrend.
This gap between short-term and long-term averages captures the core tension in INVO Fertility, Inc. stock. A violent short-term reversal is sitting inside a much larger bearish structure.
Daily pivot levels reinforce the hesitation. The pivot point stands at 2.26, with resistance at 2.57 and support at 1.72. At 2.03, the close landed below the pivot, meaning sellers regained some control after the early push toward resistance. ATR14 on the daily chart is 0.19, which is meaningful relative to a two-dollar stock and points to continued high volatility.
What the Hourly Chart Confirms and Complicates
The hourly chart is even more overbought, yet momentum has not broken down. RSI14 on the H1 chart reads 82.66, among the highest readings across all three timeframes. Meanwhile, MACD on H1 is comfortably positive. The line sits at 0.19 against a signal of 0.06, with a histogram of 0.13.
That is stronger than the daily reading, suggesting intraday momentum is still leaning bullish despite the elevated RSI. At the same time, price is sitting almost exactly on the H1 pivot point of 2.03. Resistance sits at just 2.08 and support at 1.97.
Intraday Indecision at the Pivot
That is an unusually tight range, and it tells a story of indecision right at a key level. Hourly EMA20 (1.27) and EMA50/EMA200 (both 1.13) remain far below spot price. This echoes the daily structure: the recent move has been fast and steep relative to trend averages.
Therefore, the H1 timeframe neither firmly confirms nor clearly rejects the daily bias. It reflects the same overbought stress, but momentum indicators haven’t broken down yet. This is a market catching its breath, not one that has definitively turned.
Short-Term Execution: What the 15-Minute Chart Shows
The 15-minute chart shows momentum cooling, even though the short-term regime remains bullish. RSI14 has cooled to 67.62, down from the extreme readings seen on the higher timeframes. MACD histogram has also compressed to just 0.03, versus 0.13 on the hourly and 0.08 on the daily. That is a sign that short-term momentum is decelerating, even though it remains technically positive.
Notably, price at 2.03 is currently sitting inside the 15-minute Bollinger Bands. The upper band stands at 2.83 and the lower band at 0.32. Unlike the daily and hourly charts, where price is stretched above the bands, the 15-minute structure shows some room to breathe.
The 15m pivot point sits at 2.04. Resistance and support hug tightly at 2.04 and 2.02. This confirms the stock is consolidating around current levels after the earlier reversal from 2.80.
The 15-minute regime reading is tagged bullish, in contrast to the neutral regime on both the daily and hourly charts. This divergence matters. It suggests that while the immediate short-term trend is still tilted higher, the broader structure hasn’t confirmed a fresh leg up. It looks more consistent with a pause after an aggressive spike.
Bullish Scenario for IVF Stock
The bullish case rests on momentum staying positive across all three timeframes. If IVF stock holds above the hourly pivot near 2.03 and the daily support at 1.72, the rally structure stays intact. A reclaim of the daily resistance at 2.57 would confirm that buyers are back in control. In that case, the reversal from the highs would look like profit-taking rather than a trend change. Eventually, retaking the intraday high of 2.80 would reinforce the bullish view.
Bearish Scenario and What Would Invalidate the Rally
The bearish case is built directly on the extreme overbought readings. RSI sits at 78.69 on the daily chart and 82.66 on the hourly chart. That leaves very little room for further upside before a corrective pullback becomes more likely. A daily close back below the 1.72 support level would be the clearest signal that the recent spike has failed to hold.
In that scenario, a retracement toward the daily EMA20 at 1.14 would be a logical downside target. The Bollinger midline at 1.05 would mark the next reference lower. That reflects how far price has stretched away from those averages.
In contrast to the bullish thesis, this scenario doesn’t require a fundamental shift. It simply requires momentum to catch up with the extended technical positioning already visible on every timeframe.
Closing Take
Overall, INVO Fertility, Inc. stock is caught between an explosive short-term rally and clear signs of exhaustion. Daily and hourly RSI readings above 78 and 82 respectively leave the stock vulnerable to a pullback. Meanwhile, MACD has yet to turn negative on any timeframe. The wide gap between price and the daily EMA200 at 16.38 is a reminder of the larger downtrend context still surrounding this move.
ATR14 reads near 0.19 on the daily chart and 0.25 on the 15-minute chart. Volatility is therefore likely to remain elevated in the sessions ahead. Positioning around this level requires patience. Overbought momentum readings conflict with the still-intact short-term bullish regime on the 15-minute chart.
Uncertainty remains high. The next move will likely be decided by whether the 1.72 support or the 2.57 resistance breaks first.
FAQ
Why is INVO Fertility, Inc. stock considered overbought?
RSI14 reads 78.69 on the daily chart and 82.66 on the hourly chart, both deep in overbought territory. Price also trades well above the daily Bollinger upper band of 1.51 against a midline of 1.05.
What are the key support and resistance levels for IVF stock?
Daily support sits at 1.72 and daily resistance at 2.57. The intraday high was 2.80, while the daily pivot point stands at 2.26.
What would confirm a bearish reversal?
A daily close below the 1.72 support level would be the clearest signal that the recent spike has failed to hold. A retracement toward the daily EMA20 at 1.14 or the Bollinger midline at 1.05 would then become a logical downside target.
Is the long-term trend for INVO Fertility, Inc. stock bullish or bearish?
The daily EMA200 stands at 16.38, far above the current price of 2.03. This means the stock remains deep within a much larger long-term downtrend despite the recent short-term rally.
{"@context":"https://schema.org","@type":"FAQPage","mainEntity":[{"@type":"Question","name":"Why is INVO Fertility, Inc. stock considered overbought?","acceptedAnswer":{"@type":"Answer","text":"RSI14 reads 78.69 on the daily chart and 82.66 on the hourly chart, both deep in overbought territory. Price also trades well above the daily Bollinger upper band of 1.51 against a midline of 1.05."}},{"@type":"Question","name":"What are the key support and resistance levels for IVF stock?","acceptedAnswer":{"@type":"Answer","text":"Daily support sits at 1.72 and daily resistance at 2.57. The intraday high was 2.80, while the daily pivot point stands at 2.26."}},{"@type":"Question","name":"What would confirm a bearish reversal?","acceptedAnswer":{"@type":"Answer","text":"A daily close below the 1.72 support level would be the clearest signal that the recent spike has failed to hold. A retracement toward the daily EMA20 at 1.14 or the Bollinger midline at 1.05 would then become a logical downside target."}},{"@type":"Question","name":"Is the long-term trend for INVO Fertility, Inc. stock bullish or bearish?","acceptedAnswer":{"@type":"Answer","text":"The daily EMA200 stands at 16.38, far above the current price of 2.03. This means the stock remains deep within a much larger long-term downtrend despite the recent short-term rally."}}]}
Article produced with the assistance of artificial intelligence and reviewed by the editorial team.
Disclaimer: The content of this article solely reflects the author's opinion and does not represent the platform in any capacity. This article is not intended to serve as a reference for making investment decisions.
You may also like
AI agents initiate 14M transfers through x402 protocol, led by Base
Bitcoin Futures Open Interest Outpacing Volume Sets Up a Dangerous Liquidity Mismatch
BitMine’s Ethereum Staking Engine Reaches 5.82M ETH as Buybacks Continue
Venom Foundation Proposes Standardized Blockchain TPS Benchmark
Crypto prices
More


