The BTC price prediction stays constructive after price confirmed its biggest weekly candle in three years and reclaimed a key long-term support band, a setup that has historically marked cycle bottoms rather than failed rallies. Backing that technical strength is a record week of ETF demand and a rally that looks to be built on real capital rather than leverage.
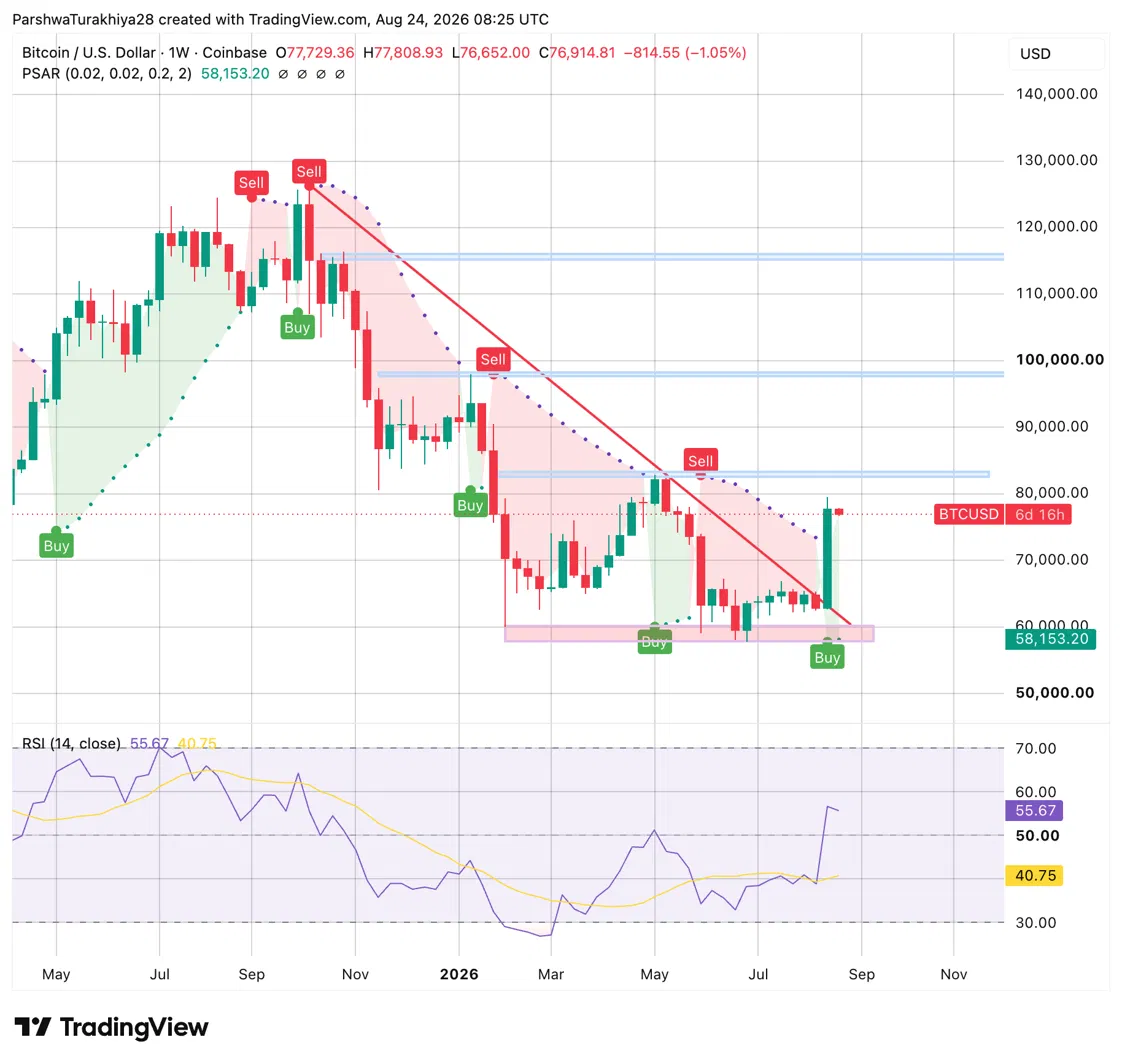 Bitcoin Price Analysis (Source: TradingView)
BTC surged sharply on the weekly chart, breaking above the descending trendline that had capped every rally since last September, and reclaiming the Parabolic SAR level at $58,153.20 well before the current session, confirming the shift in trend. Price is now consolidating near $76,914.81 after touching a weekly high of $77,808.93, pulling back slightly by 1.05% this week.
Weekly RSI has climbed to 55.67, moving decisively above the RSI moving average at 40.75 and back above the neutral 50 line for the first time since earlier this year, a sign momentum has genuinely turned. Three horizontal resistance zones sit above current price near $82,000, $97,000, and $115,000, marking prior consolidation ranges from the downtrend that BTC will need to work through on the way back up.
| Type | Price | Level |
| Resistance | $82,000 | Prior consolidation zone |
| Resistance | $97,000 | Prior consolidation zone |
| Resistance | $115,000 | Prior consolidation zone |
| Support | $77,808.93 | Weekly high, near-term support |
| Support | $58,153.20 | Parabolic SAR, reclaimed trend level |
Analyst Crypto Rover said Bitcoin just confirmed its biggest weekly candle since 2023, alongside reclaiming both the Bull Market Support Band and the 200-day moving average in the same week.
Rover noted this exact combination has happened three times across the last two bear markets. It failed to hold in 2018, but in both 2019 and 2023, it marked the actual cycle bottom.
According to CryptoQuant analyst Woominkyu, Bitcoin has climbed from $60,000 to $78,000 since early July, and the total capital positioned in the derivatives market grew from $20.6B to $24.9B over the same stretch, near the highest level of this window. What stood out is that the share of that capital coming from borrowed money, rather than actual cash, peaked on August 14, before the rally even started, and has been falling since, even as price jumped after August 19.
That matters because rallies built mainly on borrowed money tend to unwind violently, since lenders can force-sell positions once prices dip. A rally where new capital arrives without leverage climbing alongside it is generally considered more durable. Woominkyu cautioned this doesn’t guarantee prices keep rising, but said the current setup looks healthier than mid-August, when leverage was at its peak and price was going nowhere. The analyst flagged that borrowed money’s share climbing back up while price stalls would be the next warning sign to watch for.
Bitcoin ETFs pulled in $1.92B for the week ending August 21, the strongest weekly inflow of 2026 and the highest since the week of October 10, 2025, when BTC was trading near its all-time high and ETFs took in $2.71B.
Friday’s session alone added $307.45M in net inflows, with BlackRock’s IBIT leading the day at $239.28M. That single day accounted for a meaningful chunk of the week’s total, showing demand stayed strong right through the close rather than fading into the weekend.
BTC holds this week’s gains and the weekly candle pattern plays out the way it did in 2019 and 2023, confirming a genuine trend reversal rather than a failed breakout like 2018. Continued ETF inflows and capital entering the market without rising leverage support a sustainable move higher. A push through the near-term high opens the path toward the first resistance zone at $82,000.
BTC’s rally shows signs of the 2018 failure pattern, where the same technical setup gave way to renewed selling instead of a bottom. Borrowed money’s share of total capital starts climbing again while price stalls, the exact warning sign Woominkyu flagged, and ETF inflows cool off from their record pace. Price falls back toward the reclaimed Parabolic SAR level at $58,153.20, undoing this week’s breakout.
This setup earns more scrutiny than a typical bullish chart pattern precisely because it has a real track record to check it against, two confirmed bottoms and one failure, not a theoretical signal being tested for the first time. What separates this instance from 2018 so far is the capital structure underneath it: leverage was rising into that failed breakout, while this time it’s been falling since before the rally even started.
That’s the specific detail worth tracking going forward, since Woominkyu’s warning is clear that a reversal in that leverage trend, not just a price pullback, would be the signal this setup is repeating 2018 rather than 2019 or 2023.
BTC trades at $76,914.81 after confirming its biggest weekly candle since 2023. The bullish target is $82,000, while the bearish risk level is $58,153.20 at the Parabolic SAR if the setup fails like it did in 2018.
Possibly. Analyst Crypto Rover says the same combination of a major weekly candle and a reclaimed Bull Market Support Band has appeared three times in the last two bear markets, marking the actual cycle bottom twice, in 2019 and 2023, and failing once, in 2018.
CryptoQuant data shows the share of derivatives capital coming from borrowed money peaked on August 14, before the rally started, and has been falling since even as price climbed, suggesting fresh capital rather than rising leverage is driving the move.
Bitcoin ETFs pulled in $1.92 billion for the week ending August 21, the strongest week of 2026 and the highest since October 2025, with Friday alone adding $307.45 million led by BlackRock’s IBIT.