Today is Friday, and August has entered its final phase. After two consecutive weeks of strong rallies, BTC's monthly chart has risen for the second month in a row, with August showing a clear bullish structure. Although the trend remains strong, after continuous upward movement, the need for a technical pullback at the monthly chart level is becoming increasingly evident.
Especially as we enter the window for the end and start of the month, it is important to be alert for concentrated profit-taking at high levels.
The current market is more inclined to maintain a high-level range-bound consolidation. The difficulty for a direct, continued surge has obviously increased. At this stage, instead of chasing the rally, it is better to wait for a pullback to key support for a buying opportunity; if a rebound stalls in the resistance area, short-term short opportunities can be considered.
The most important factor here remains trading volume.
If the price breaks through key resistance without a corresponding surge in trading volume, it is more likely to be a false breakout or even a bull trap; only a genuine breakout with strong volume will qualify to further open up the upside.
At the macro level, there is still considerable uncertainty regarding monetary policy in September. Any shift in expectations at the high point may act as a catalyst for profit-taking.
₿ BTC
Opinion: Bearish bias at high levels, focus on guarding against "the last bull trap".
BTC gave the market another lesson today.
On the 1-hour chart, after surging near 81,500, it quickly encountered selling pressure, with the price dropping nearly 1,700 points in a short time. This shows that the battle between bulls and bears above 80,000 has clearly intensified.
ETH performed even weaker. Without breaking its own previous high, it was dragged down rapidly by BTC.
Currently, BTC has returned to the 2-hour support and the previous rally launch area for consolidation. Whether effective support forms here will determine if BTC continues to trade at high levels or begins a larger-scale pullback.
A shift in mindset is needed at present:
Sudden acceleration at high levels is not necessarily a signal to chase longs—on the contrary, it may be a window for bears to enter.
Especially if BTC again surges into the 80,800–81,300 area, rapid rally without volume and a resulting long upper shadow would raise caution for a bull trap followed by another sharp drop.
Support: 79,100–79,500
Resistance: 80,800–81,300
⟠ ETH
Opinion: Weaker than BTC, bearish bias at high levels, 2,600 remains a key threshold.
ETH has recently been distinctly weaker than BTC. The main issue is still the ETH/BTC ratio lacking momentum for sustained gains.
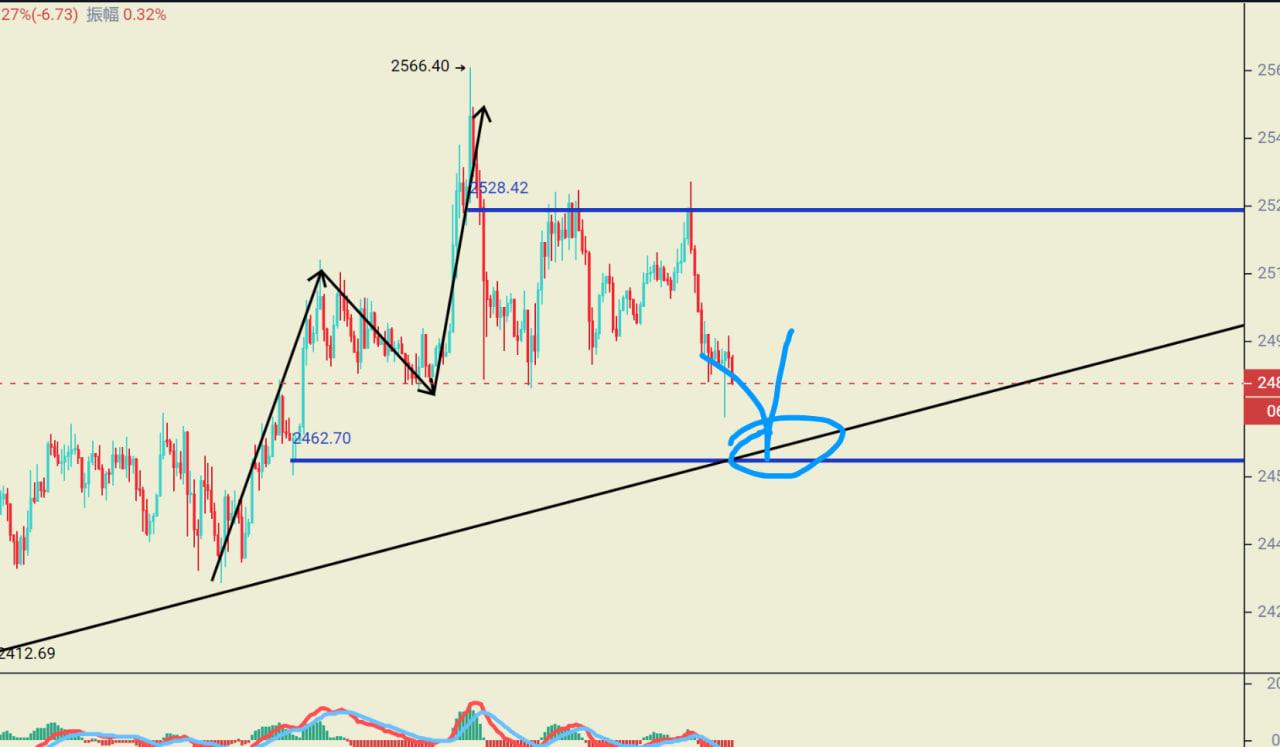
Yesterday, after reaching a high near 2,566, bulls quickly lost momentum, and ETH has re-entered high-level range consolidation. Meanwhile, the Bollinger Bands are narrowing, suggesting the current consolidation is compressing volatility and a new directional move is approaching.
Pay close attention to the 12-hour and daily chart structures.
Both major timeframes show clear adjustment needs, so even if there's another rapid rally in the short term, it should not be easily defined as the start of a new bullish wave.
If the ETH/BTC ratio cannot show clear strength, ETH will still face considerable difficulty in breaking 2,600 independently.
Thus, the current strategy is best:
Don’t chase rapid rallies; watch for stall around resistance. Wait for pullbacks to key support and then assess for buying opportunities.
Support: 2,470–2,480, 2,430–2,450
Resistance: 2,533, 2,565, 2,600