Li Ying Crypto Chat: 8.30 Bitcoin (BTC) and Ethereum (ETH) Latest Market Analysis
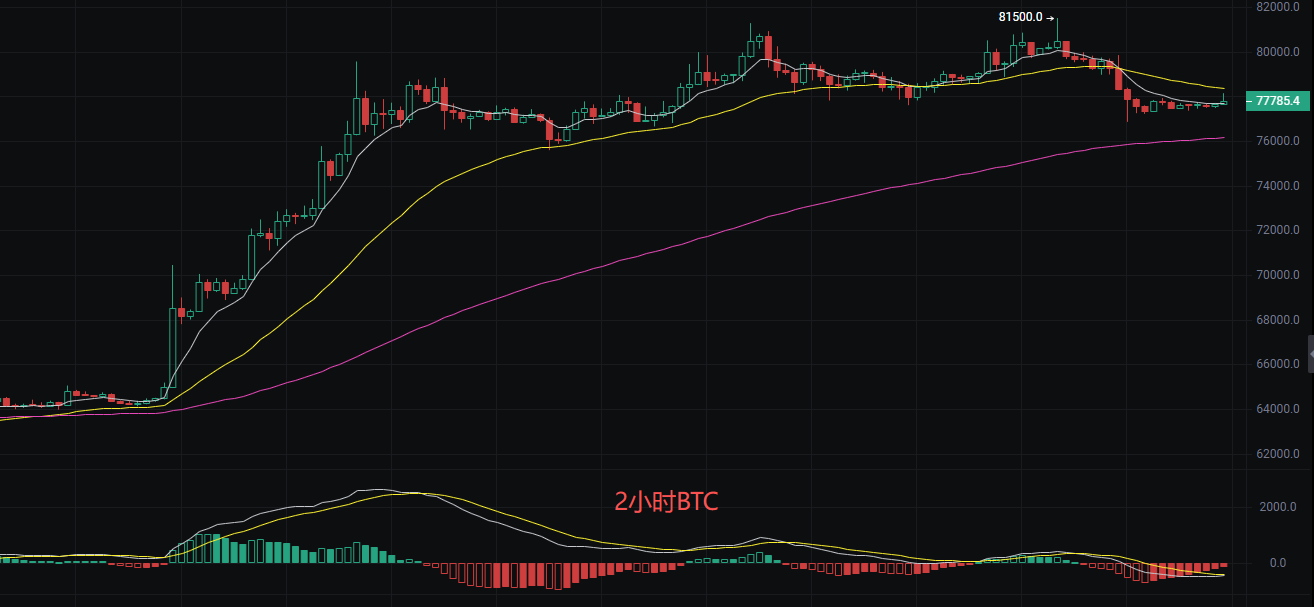
Family! Bitcoin’s current price is 77,800. The recent days’ pullback clearly tells us that it’s hard to stay at the top. Technical indicators now show a cautious outlook. In the EMA moving average system, the short-term EMA7 has crossed below the medium-term EMA30, forming a preliminary death cross, and the price is running below EMA30, indicating short-term upward momentum has faded and bearish power is increasing. The MACD indicator shows both DIF and DEA are below the zero axis and continuing downward, suggesting the downtrend is not finished yet. The price has broken below the middle band at 78,382 and is testing the lower band support at 76,414; if it breaks below that effectively, a new round of decline may start. Conversely, if it finds support at the lower band and rebounds, it could return to above the middle band and oscillate. Overall, the technical side is bearish, but there are initial signs of oversold conditions, so be alert to a possible rebound that could trap longs.
Short-term strategy reference:
Go long around 77,000-76,500, stop loss at 500 points, target 78,500 aiming for 79,500
Go short around 79,500-80,500, stop loss at 500 points, target 78,500 aiming for 77,500
Ethereum
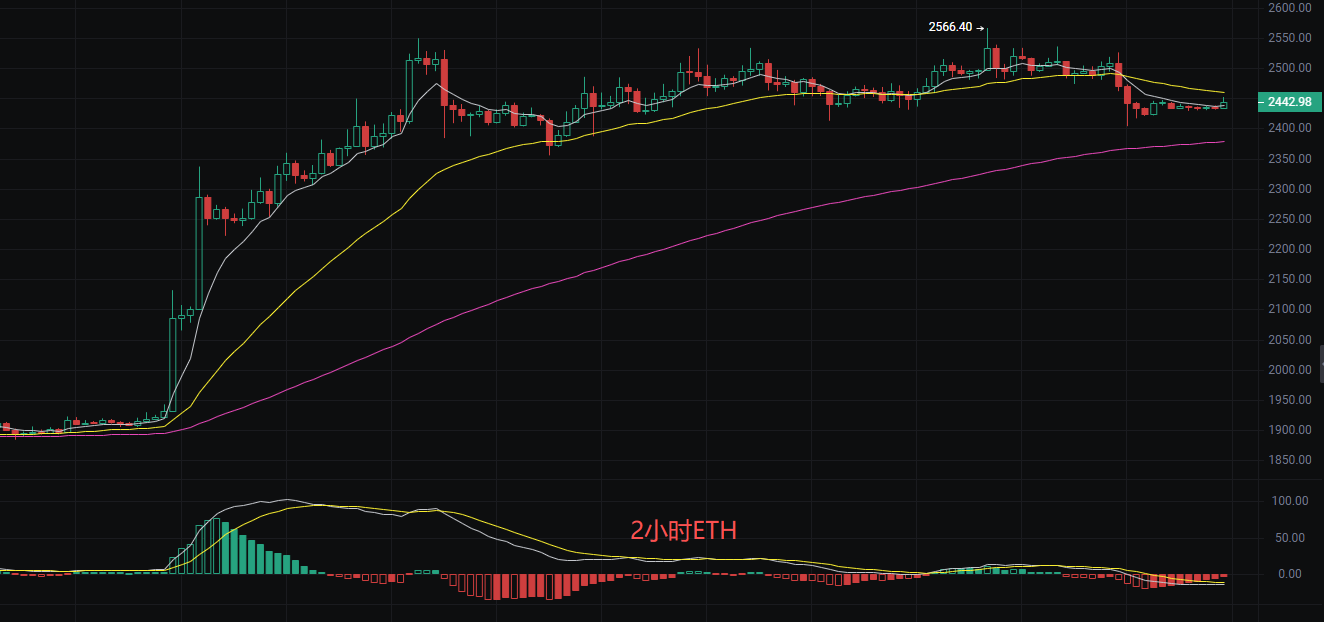
Family, Ethereum’s current price is 2,444; after big gains, it needs a break. Now it’s clearly entered a consolidation and pullback phase. Unable to rise further or fall much, looking at technical indicators: the EMA moving average system shows the short-term EMA7 has crossed below the medium-term EMA30, creating a death cross, but the long-term EMA120 is still spreading upward, indicating the medium- to long-term trend is intact. MACD indicator shows DIF and DEA moving downward after a death cross above the zero axis, showing bearish momentum is weakening but bulls haven’t counterattacked yet. The middle band of the Bollinger Bands at 2,459 is the current resistance level, lower band at 2,400 is strong support, price is between the middle and lower bands, indicating a weak consolidation pattern. Overall, the market is balanced with resistance above and support below, waiting for a directional breakout.
Short-term price reference
Go long at 2,430, defend at 2,400, stop loss at 40 points, target 2,470 aiming for 2,520
Go short at 2,490, defend at 2,520, stop loss at 40 points, target 2,460 aiming for 2,420
The above content is exclusively created by Li Ying. Please cite the source if reposted! Article review may be delayed, market is volatile; these suggestions are for reference only, proceed at your own risk.