

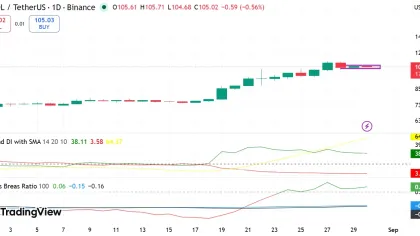
Solana has staged one of the most notable recoveries in 2026, outperforming competitors such as Hyperliquid with its latest technical momentum. After a steady ascent from nearly $75 in August, SOL is now trading at approximately $104.65, marking a gain of close to 45% from its recent consolidation range.
Solana gains 45% as breakout outpaces Hyperliquid, faces key $110 resistance
By:Cointurk
Bitget offers one-stop trading for cryptocurrencies, stocks, and gold. Trade now!
A welcome pack worth 6200 USDT for new users! Sign up now!
Breakout over major averages
The latest rally saw Solana moving decisively above critical long-term barriers. The cryptocurrency broke through its 50-day and 100-day moving averages, which had been situated around $80.78 and $82.46. This bullish momentum continued as SOL surged to a peak above $110, with a key move occurring as Solana advanced past the significant price zone near $90 before targeting higher levels.
Both the 20-day exponential moving average (EMA) and the 200-day moving average are now located close to $90.06 and $90.18. SOL accelerated past the 200-day average on rising trading volumes, showing no immediate pullback at that threshold. SOL’s price now stands more than 15% above this key indicator, reinforcing its relative technical strength versus competitors such as Hyperliquid, which remain below their major trend resistance levels.
Mini dictionary: Hyperliquid is a decentralized derivatives trading platform focused on speed and capital efficiency, offering perpetual futures with advanced risk management tools primarily on blockchain networks.
ETH
SOL
BSC
ROBINHOOD
PAY
USDT
RECEIVE
AAPL
Indicator Solana Hyperliquid
| Current price | $104.65 | Below major averages |
| Position vs. 200-day average | Above (+15%) | Below |
Overbought signal and short-term risks
Strong momentum also produced signs of overextension. The daily Relative Strength Index (RSI) for Solana exceeded 80 during the rally, briefly indicating heavily overbought conditions, before settling near 73.4. As trading volume returns to more normal levels, analysts note that entering positions between $105 and $110 presents a greater risk than earlier in the breakout, when prices ranged between $80 and $90.
Immediate technical challenges remain. The $110 to $111 price band represents the next resistance zone, and clearing this region could send SOL toward $115 or even $120. On the flip side, a retracement to $100, followed by the significant support at $90, remains possible if bullish momentum stalls. The $90 area now acts as the defining technical boundary for this trend.
Key support and the outlook ahead
A successful retest of the $90 support would underscore the argument that Solana has solidified its reversal and that former long-term resistance levels have flipped to new support. The structural advantage for SOL is its ability to break through these barriers decisively in advance of its peers.
With over 15% gains above its 200-day average and a strong breakout, Solana now faces the challenge of defending its recent progress against any potential reversals in momentum.
Traders are now monitoring whether buyers can continue to defend these gains and sustain Solana’s position above critical technical levels in the coming sessions.
0
0
Disclaimer: The content of this article solely reflects the author's opinion and does not represent the platform in any capacity. This article is not intended to serve as a reference for making investment decisions.
Understand the market, then trade.
Bitget offers one-stop trading for cryptocurrencies, stocks, and gold.
Trade now!
You may also like
Solana whales buy $41.5M in SOL – Can price reclaim $110?
AMBCrypto•2026/08/30 13:03
BlackRock Records $1 Billion Ethereum Inflow
UToday•2026/08/30 12:33
XRP falls 69% from January peak, whales buy 380 million tokens amid $1.5 billion liquidation
Cointurk•2026/08/30 12:21
Trader DonAlt eyes Ethereum breakout after 30% rally, sets $2,816 as next target
Cointurk•2026/08/30 12:12
Crypto prices
More
Bitcoin
BTC
$78,732.76
+1.48%

Ethereum
ETH
$2,467.15
+1.35%

Tether USDt
USDT
$1.0000
+0.00%

BNB
BNB
$695.69
+1.12%

XRP
XRP
$1.4
+1.23%

USDC
USDC
$1.0000
+0.01%

Solana
SOL
$106.04
+2.36%

TRON
TRX
$0.3404
+0.51%

Hyperliquid
HYPE
$83.71
+2.80%

Zcash
ZEC
$850.26
+5.23%
How to buy BTC
Bitget lists BTC – Buy or sell BTC quickly on Bitget!
Trade now
Become a trader now?A welcome pack worth 6200 USDT for new users!
Sign up now