

Zcash is maintaining strong upward momentum following a breakout through several significant resistance levels, positioning the cryptocurrency near a key historical supply zone. Recent technical signals indicate the asset could soon face a critical decision point as traders assess its next move.
Zcash rally tests $900 resistance after 4% surge, ETF trading adds momentum
By:Cointurk
Bitget offers one-stop trading for cryptocurrencies, stocks, and gold. Trade now!
A welcome pack worth 6200 USDT for new users! Sign up now!
Price rally and technical setup
Zcash is currently priced at $870.72, reflecting a 4.17% increase over the past 24 hours. Trading volume reached $6.35 billion, while market capitalization stands at $14.67 billion. The cryptocurrency’s market dominance is now recorded at 0.55%. This surge brings Zcash close to a historically important resistance range between $850 and $900.
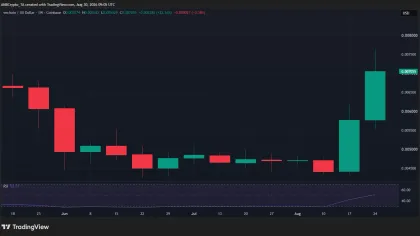
The recent rally followed breakouts above resistance levels at $570, $600, and $640, illustrating growing buying interest. The move also coincided with a breakout from a daily triangle pattern that had been in place since June. Technically, this formation accelerated the ongoing impulse wave and enabled a rapid climb above $675.
Current price patterns resemble those seen in previous Zcash market cycles. In 2017-2018, the cryptocurrency rose from around $22 to nearly $900 before experiencing a steep decline of approximately 98%. The 2020-2021 bull run saw ZEC advance from $18.50 up to $372, only to fall back by 96% during the subsequent retracement.
ETH
SOL
BSC
ROBINHOOD
PAY
USDT
RECEIVE
AAPL
Institutional catalyst and on-chain dynamics
Analyst Crypto Patel attributes the latest rally to an accumulation phase that began near $15.85 in July 2024. Patel notes that ZEC has closely followed previous cycle structures during its path towards current levels.
Grayscale’s spot Zcash ETF, launched on NYSE Arca on August 25, has opened the door for new institutional participation in the market. This ETF is seen as a fresh catalyst, providing a broader audience with more accessible exposure to Zcash.
Technical indicators point to growing caution as Zcash approaches the critical $850–$900 resistance range. The relative strength index (RSI) has developed a bearish divergence, suggesting that momentum has not fully supported the most recent price appreciation.
Zcash is now trading in a historically significant $850–$900 resistance region, where RSI bearish divergence implies that the asset’s recent rally may be losing momentum, potentially increasing volatility if buyers fail to break and sustain above resistance.
As a result, analysts highlight the risk of increased volatility and potential resistance at these levels. A sustained breakout and confirmed support above $900 would be required to alter the current technical structure and reinforce bullish sentiment. Failure to break through may expose ZEC to renewed selling pressure and a possible retracement after its move higher.
Broader market trends and innovation
For Zcash investors, the focus remains on whether market participants can convert the $850–$900 resistance into a platform for further gains. Technical observers recommend tracking volume, momentum confirmation, and market response to this area rather than relying solely on previous breakout patterns.
The immediate technical threshold is at $900. If buyers establish support above it, the bullish structure could strengthen, while rejection could put ZEC at risk of a deeper correction following its notable advance.
0
0
Disclaimer: The content of this article solely reflects the author's opinion and does not represent the platform in any capacity. This article is not intended to serve as a reference for making investment decisions.
Understand the market, then trade.
Bitget offers one-stop trading for cryptocurrencies, stocks, and gold.
Trade now!
You may also like
Crypto market’s weekly winners and losers – VET, RAIN, STABLE, ARB
AMBCrypto•2026/08/30 22:03
DeFi Sector Jumps 38% as US Policy Shift Unlocks Token Value Capture
Cryptopotato•2026/08/30 21:36
Bitcoin, Ethereum and XRP Prices Brace For Jobs Report Week as Fed Decision Looms
Coinpedia•2026/08/30 21:33

A Verified Donald Trump Account Announced the Launch of a New Altcoin: Its Price Plummeted to Zero Overnight
CryptoNewsNet•2026/08/30 21:12

Crypto prices
More
Bitcoin
BTC
$78,414.49
+0.28%

Ethereum
ETH
$2,471.16
+0.78%

Tether USDt
USDT
$0.9999
-0.01%

BNB
BNB
$694.46
+0.24%

XRP
XRP
$1.39
-0.53%

USDC
USDC
$1.0000
-0.00%

Solana
SOL
$103.71
-1.48%

TRON
TRX
$0.3384
-0.74%

Hyperliquid
HYPE
$81.02
-2.93%

Zcash
ZEC
$861.84
+2.57%
How to buy BTC
Bitget lists BTC – Buy or sell BTC quickly on Bitget!
Trade now
Become a trader now?A welcome pack worth 6200 USDT for new users!
Sign up now