
A chart of commodity support and resistance: gold, silver, oil, gas, platinum, palladium, copper, and agricultural futures (September 1, 2026)

Huitong Network, September 1—— One chart shows commodity support and resistance: gold, silver, oil, gas + platinum, palladium, copper + agricultural futures. Updated on Tuesday, September 1, 2026, 06:30 (UTC+8), covering a total of 14 varieties including gold, silver, platinum, palladium, copper + crude oil, natural gas, fuel oil + wheat, corn, cotton. For more details, see the specially made chart analysis by Huitong Finance.
One chart shows commodity support and resistance: gold, silver, oil, gas + platinum, palladium, copper + agricultural futures. Updated on Tuesday, September 1, 2026, 06:30 (UTC+8), covering gold, silver, platinum, palladium, copper + crude oil, natural gas, fuel oil + wheat, corn, cotton, totaling 14 varieties. For more details, see the chart analysis by Huitong Finance.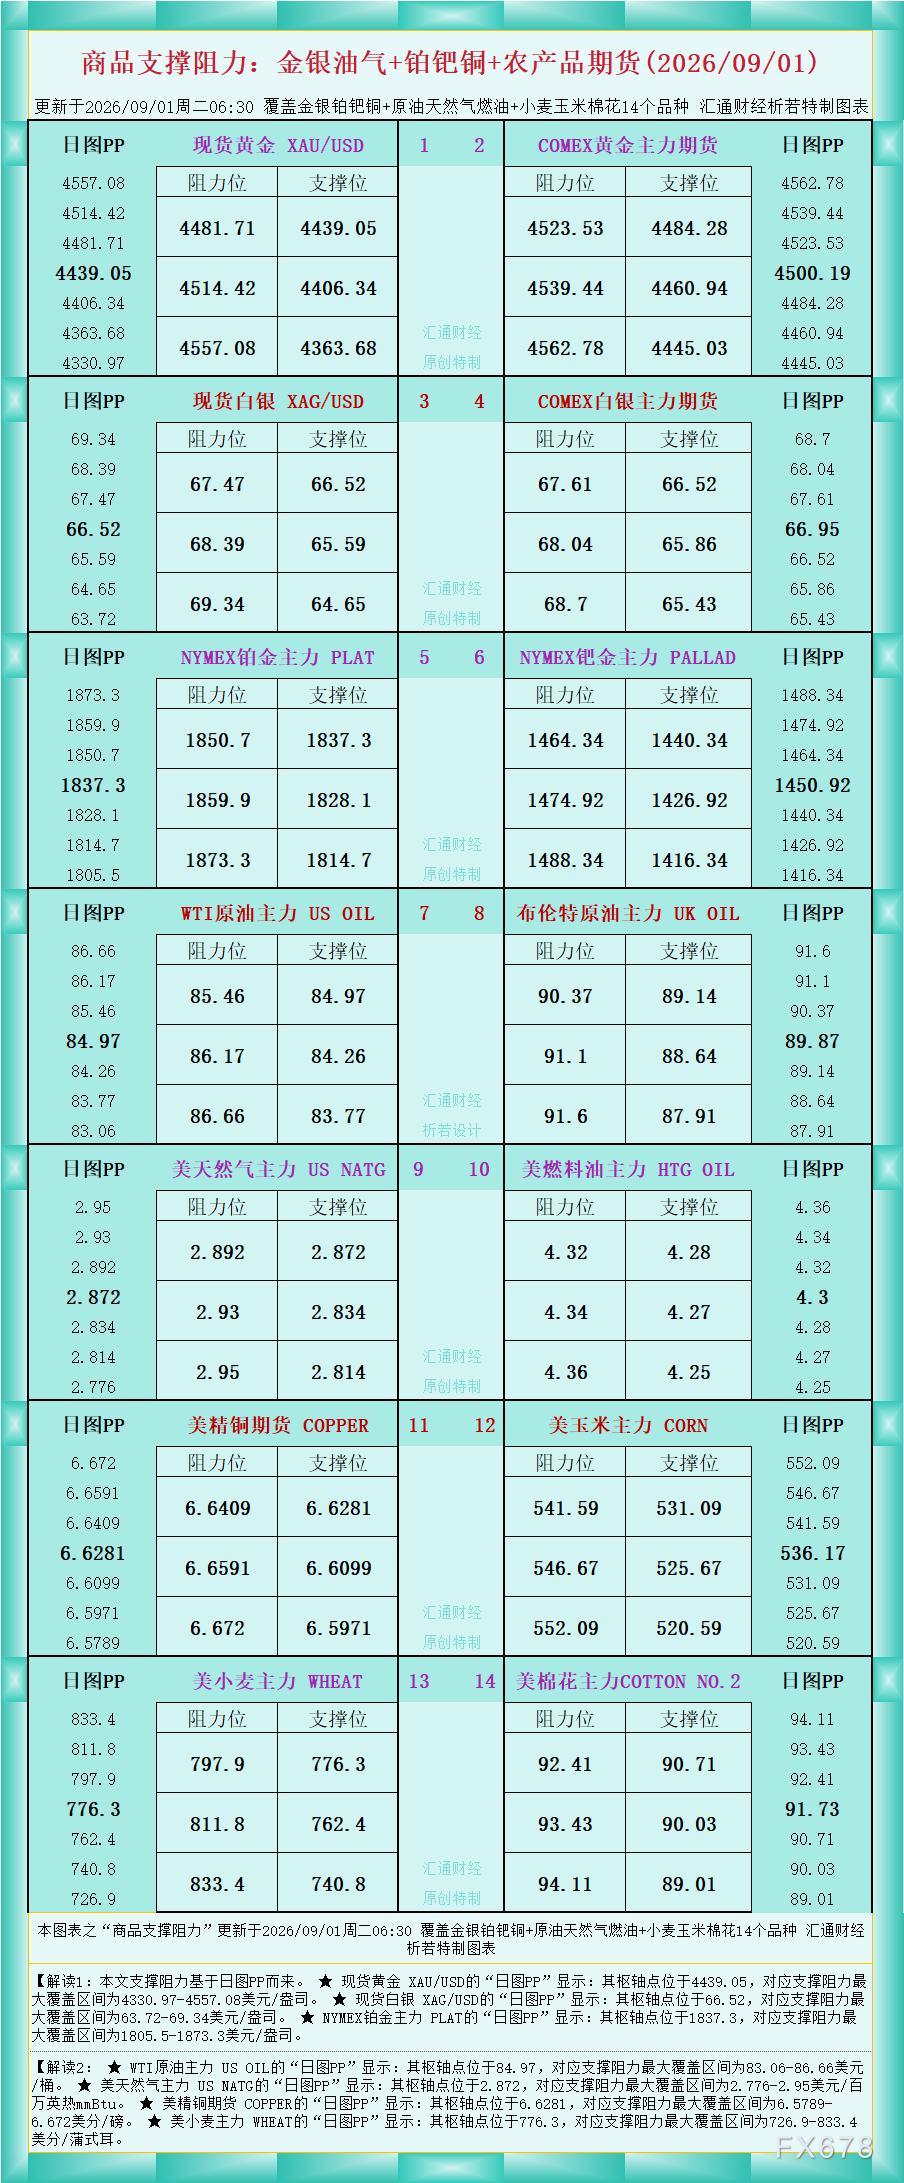
According to the chart data, Interpretation 1: The support and resistance in this article is based on daily PP.
★ The “daily PP” for spot gold XAU/USD shows: The pivot point is at 4439.05, and the maximum support and resistance range is 4330.97–4557.08 USD/ounce.
★ The “daily PP” for spot silver XAG/USD shows: The pivot point is at 66.52, and the maximum support and resistance range is 63.72–69.34 USD/ounce.
★ The “daily PP” for NYMEX platinum main contract PLAT shows: The pivot point is at 1837.3, and the maximum support and resistance range is 1805.5–1873.3 USD/ounce.
Interpretation 2:
★ The “daily PP” for WTI crude oil main contract US OIL shows: The pivot point is at 84.97, and the maximum support and resistance range is 83.06–86.66 USD/barrel.
★ The “daily PP” for US natural gas main contract US NATG shows: The pivot point is at 2.872, and the maximum support and resistance range is 2.776–2.95 USD/million British thermal units mmBtu.
★ The “daily PP” for US copper futures COPPER shows: The pivot point is at 6.6281, and the maximum support and resistance range is 6.5789–6.672 cents/pound.
★ The “daily PP” for US wheat main contract WHEAT shows: The pivot point is at 776.3, and the maximum support and resistance range is 726.9–833.4 cents/bushel.
For further interpretation of other varieties, see the chart.
Disclaimer: The content of this article solely reflects the author's opinion and does not represent the platform in any capacity. This article is not intended to serve as a reference for making investment decisions.
You may also like
Japan’s Katayama: Confirmed with Bessent that continued, coordinated action on FX is needed
Renowned tech investor Gavin Baker: Data centers are creating a large number of high-paying blue-collar jobs
Baker believes that the construction of data centers can boost tax revenues in small towns and create high-paying blue-collar jobs. He also points out that the low natural gas prices in the United States provide a manufacturing cost advantage. He stated, "Learning trades like electrician, plumber, or HVAC technician now can earn you astonishing incomes, which in some cases might even surpass the net present value of going to college."
StrategX Elements extends non-brokered private placement deadline to Sept. 30, 2026
10-Yr Benchmark Govt Yields - U.S. vs Other Nations
Crypto prices
More


