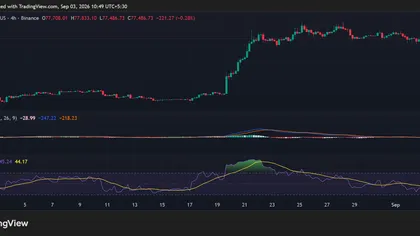
- The same TD Sequential signal has identified three consecutive ADA bottoms in 2026 — preceding rallies of +44.48%, +11.48%, and +50.85% respectively.
- Key levels: $0.1894 support (invalidation below) and $0.2584 resistance as the primary upside target if the fourth signal follows the pattern of the prior three.
Cardano is printing a technical signal that has done something rare in 2026 — it has been right three times in a row. After ADA’s +50.85% surge from the August 18 buy signal cooled and price pulled back toward the $0.195 zone, the Tom DeMark Sequential indicator has printed a new daily “9” buy signal at almost exactly the same technical exhaustion level.
At the time of writing, ADA is trading at approximately $0.2053 — up 3.43% in 24 hours — with a market capitalization of approximately $7.54 billion. The daily chart is showing the new buy signal while price sits in the $0.195–$0.205 support zone that has been the launching point for each of the three prior rebounds this summer.
The TD Sequential Buy Signal — Three for Three in 2026
The analytical foundation of the current ADA setup is the Tom DeMark (TD) Sequential indicator’s track record on ADA’s daily chart over the past three months — and that track record is unusually clean.
The TD Sequential has done an “excellent job identifying recent bottoms” on ADA’s daily chart, with three consecutive buy signals each preceding a meaningful price recovery:
| June 25, 2026 | TD Sequential “9” Buy | +44.48% |
| July 15, 2026 | TD Sequential “9” Buy | +11.48% |
| August 18, 2026 | TD Sequential “9” Buy | +50.85% |
| September 2026 | TD Sequential “9” Buy | Pending |
The pattern across the three prior signals is consistent: the “9” buy marker appears after a sequence of declining daily closes that exhausts the selling pressure — the TD Sequential’s design specifically counts nine consecutive bars closing lower than a reference bar, which identifies momentum exhaustion rather than a price level.
The August 18 signal produced the largest of the three moves — +50.85% — carrying ADA from the ~$0.175 low to a peak near $0.2584 before the cooling pullback that has brought price back toward the current $0.195–$0.205 zone. The fact that the new buy signal is now appearing in almost exactly the same price area that launched the largest prior move adds structural weight to the current setup.
What the Daily Chart Is Showing
The daily chart maps the four TD Sequential buy signals across ADA’s summer 2026 price action — and the visual pattern is striking for its consistency.
The Three Prior Signals — A Pattern of Exhaustion Points
Each of the three prior “9” buy signals appeared after ADA had declined into a local exhaustion zone:
June 25 signal (~$0.130 area): The first “9” buy appeared after ADA’s early summer decline — price was deeply oversold at the summer lows before the +44.48% recovery toward the $0.186 range.
July 15 signal (~$0.175 area): After a partial retracement from the June high, a second “9” buy signal appeared — followed by a more modest +11.48% bounce before the next leg of the corrective phase.
August 18 signal (~$0.175 area): The third and most powerful signal appeared at a similar exhaustion level — producing the largest move of the three at +50.85% and carrying ADA to the $0.255+ peak visible on the chart.
The Current Signal — Fourth at the Same Zone
The fourth “9” buy signal has now appeared near the $0.195 level — the area where price has pulled back following the August rally’s cooling. The current signal is appearing after a similar sequence of declining daily closes that exhausted the selling pressure from the post-$0.255 pullback.
The chart shows the new “9” marker at the bottom of the current consolidation, with price at $0.2053 — already showing early signs of bounce from the signal zone.
The $0.1894 Support and $0.2584 Target — The Trade Framework
The current ADA setup has two clearly defined structural levels that bracket the setup:
$0.1894 — The Critical Support (Invalidation Level)
$0.1894 is the key support level that must hold for the TD Sequential buy signal thesis to remain valid. This level represents the structural floor below which the current signal zone would be broken — indicating that the buying exhaustion identified by the indicator has not yet fully absorbed the selling pressure, and that a deeper retest is required before the bounce can develop.
A sustained daily close below $0.1894 would weaken the setup and suggest the fourth TD Sequential signal is not following the pattern of the prior three.
$0.2584 — The Primary Target (Prior August High)
$0.2584 is the resistance level that represents the first major upside objective — the approximate peak of the August 18-driven +50.85% rally. If the fourth TD Sequential signal follows the pattern of its predecessors and produces a comparable move, the $0.2584 level is the natural first target — representing approximately +25.8% upside from the current price of $0.2053.
The $0.2584 level has a dual significance: it is both the prior cycle’s resistance and the point from which the most recent pullback began. A reclaim of this level would confirm that the pattern has repeated a fourth consecutive time.
Why the Signal Is Appearing Here — The Technical Logic
The TD Sequential’s strength as a reversal identification tool comes from its mechanical design — it counts nine consecutive bars closing lower than a reference bar, which identifies when a downtrend has run for a statistically significant number of consecutive sessions. The signal is not based on price levels or moving averages — it is based on the duration and consistency of the selling sequence.
This is why the signal appeared in the current $0.195–$0.205 zone rather than at a specific price level. The selling sequence that followed the August $0.255+ peak reached its ninth consecutive lower close in this range — producing the “9” marker that indicates selling momentum exhaustion regardless of where the price happens to be.
The three prior signals worked not because the price level was structurally significant, but because the selling exhaustion they identified was genuine — and the market confirmed that exhaustion with a bounce in each case. The current signal is identifying the same exhaustion condition at the end of the post-August pullback.
Bullish vs. Bearish Scenarios
Bullish Scenario
ADA holds above the $0.1894 support — confirming that the TD Sequential buy signal’s exhaustion identification is valid and that the selling pressure from the post-August pullback has been absorbed. Price builds momentum from the $0.195–$0.205 zone and stages a recovery toward the first major resistance at $0.2584 — the prior August high. If the fourth signal produces a move comparable to the three prior instances, the $0.2584 target represents approximately +25.8% upside from the current level. In this scenario, the broader crypto bull environment provides the macro tailwind for the technical setup to activate.
Bearish Scenario
ADA loses the $0.1894 support on a sustained daily close — breaking below the signal zone and indicating that the fourth TD Sequential buy signal has failed to identify a genuine exhaustion point. In this scenario, the pattern’s three-for-three track record is broken, and lower support levels in the $0.165–$0.175 range become the next reference. The three-consecutive-signal track record would not be disproven by a single failure, but the invalidation of the current setup would require a reassessment of the signal’s reliability on ADA’s daily chart at this stage of the cycle.
Bottom Line
Cardano’s daily TD Sequential indicator has printed a “9” buy signal for the fourth time in the summer 2026 cycle — at almost exactly the same structural exhaustion zone that produced rebounds of +44.48%, +11.48%, and +50.85% on the three prior occasions. The signal is not appearing after a random dip — it is repeating at a consistent pattern of selling exhaustion points that the indicator has correctly identified three consecutive times.
$0.1894 is the support that must hold. $0.2584 is the primary target if the fourth signal follows its predecessors. At the current price of $0.2053, ADA is showing early signs of bounce from the signal zone — and the broader macro environment is the most constructive it has been all year for altcoin setups of this type to activate.
Three for three is a track record. Whether it becomes four for four will be answered at the $0.1894 and $0.2584 levels in the sessions ahead.
Frequently Asked Questions
Is Cardano flashing a buy signal in September 2026?
Yes. The Tom DeMark Sequential has printed a new daily buy signal on ADA near the $0.195 area.
How accurate have recent ADA TD Sequential signals been?
The last three daily buy signals were followed by rallies of about 44.5% in June, 11.5% in July, and 50.9% in August.