

XRP is trading at $1.39, erasing yesterday’s gains and complicating any XRP price forecast that leans on the August recovery holding. Move that reopens an old question for holders: why does a token keep bleeding while the company behind it just got valued at $50 billion?
Ripple’s employee share buyback in March 2026 pegged the company’s worth above Coinbase’s market cap at the time. XRP hasn’t shared in that success. There’s a mechanical reason for that gap, and it’s not going away soon.
Ripple’s payments network processes cross-border transfers in three to five seconds for a fraction of a cent, but banks don’t need XRP to use it. Ripple confirmed over 300 network customers back in 2019. Only a handful, including SBI Remit and Travelex Bank, are known to actually route liquidity through the token itself.
Meanwhile, the XRP Ledger’s decentralized finance total value locked sits under $50 million, according to DefiLlama, trailing roughly 40 other chains and dwarfed by Ethereum’s roughly $50 billion. Traders this week are more focused on the Senate’s procedural vote on the CLARITY Act than on any of that ecosystem data.
Utility on paper doesn’t always translate into demand on-chain.
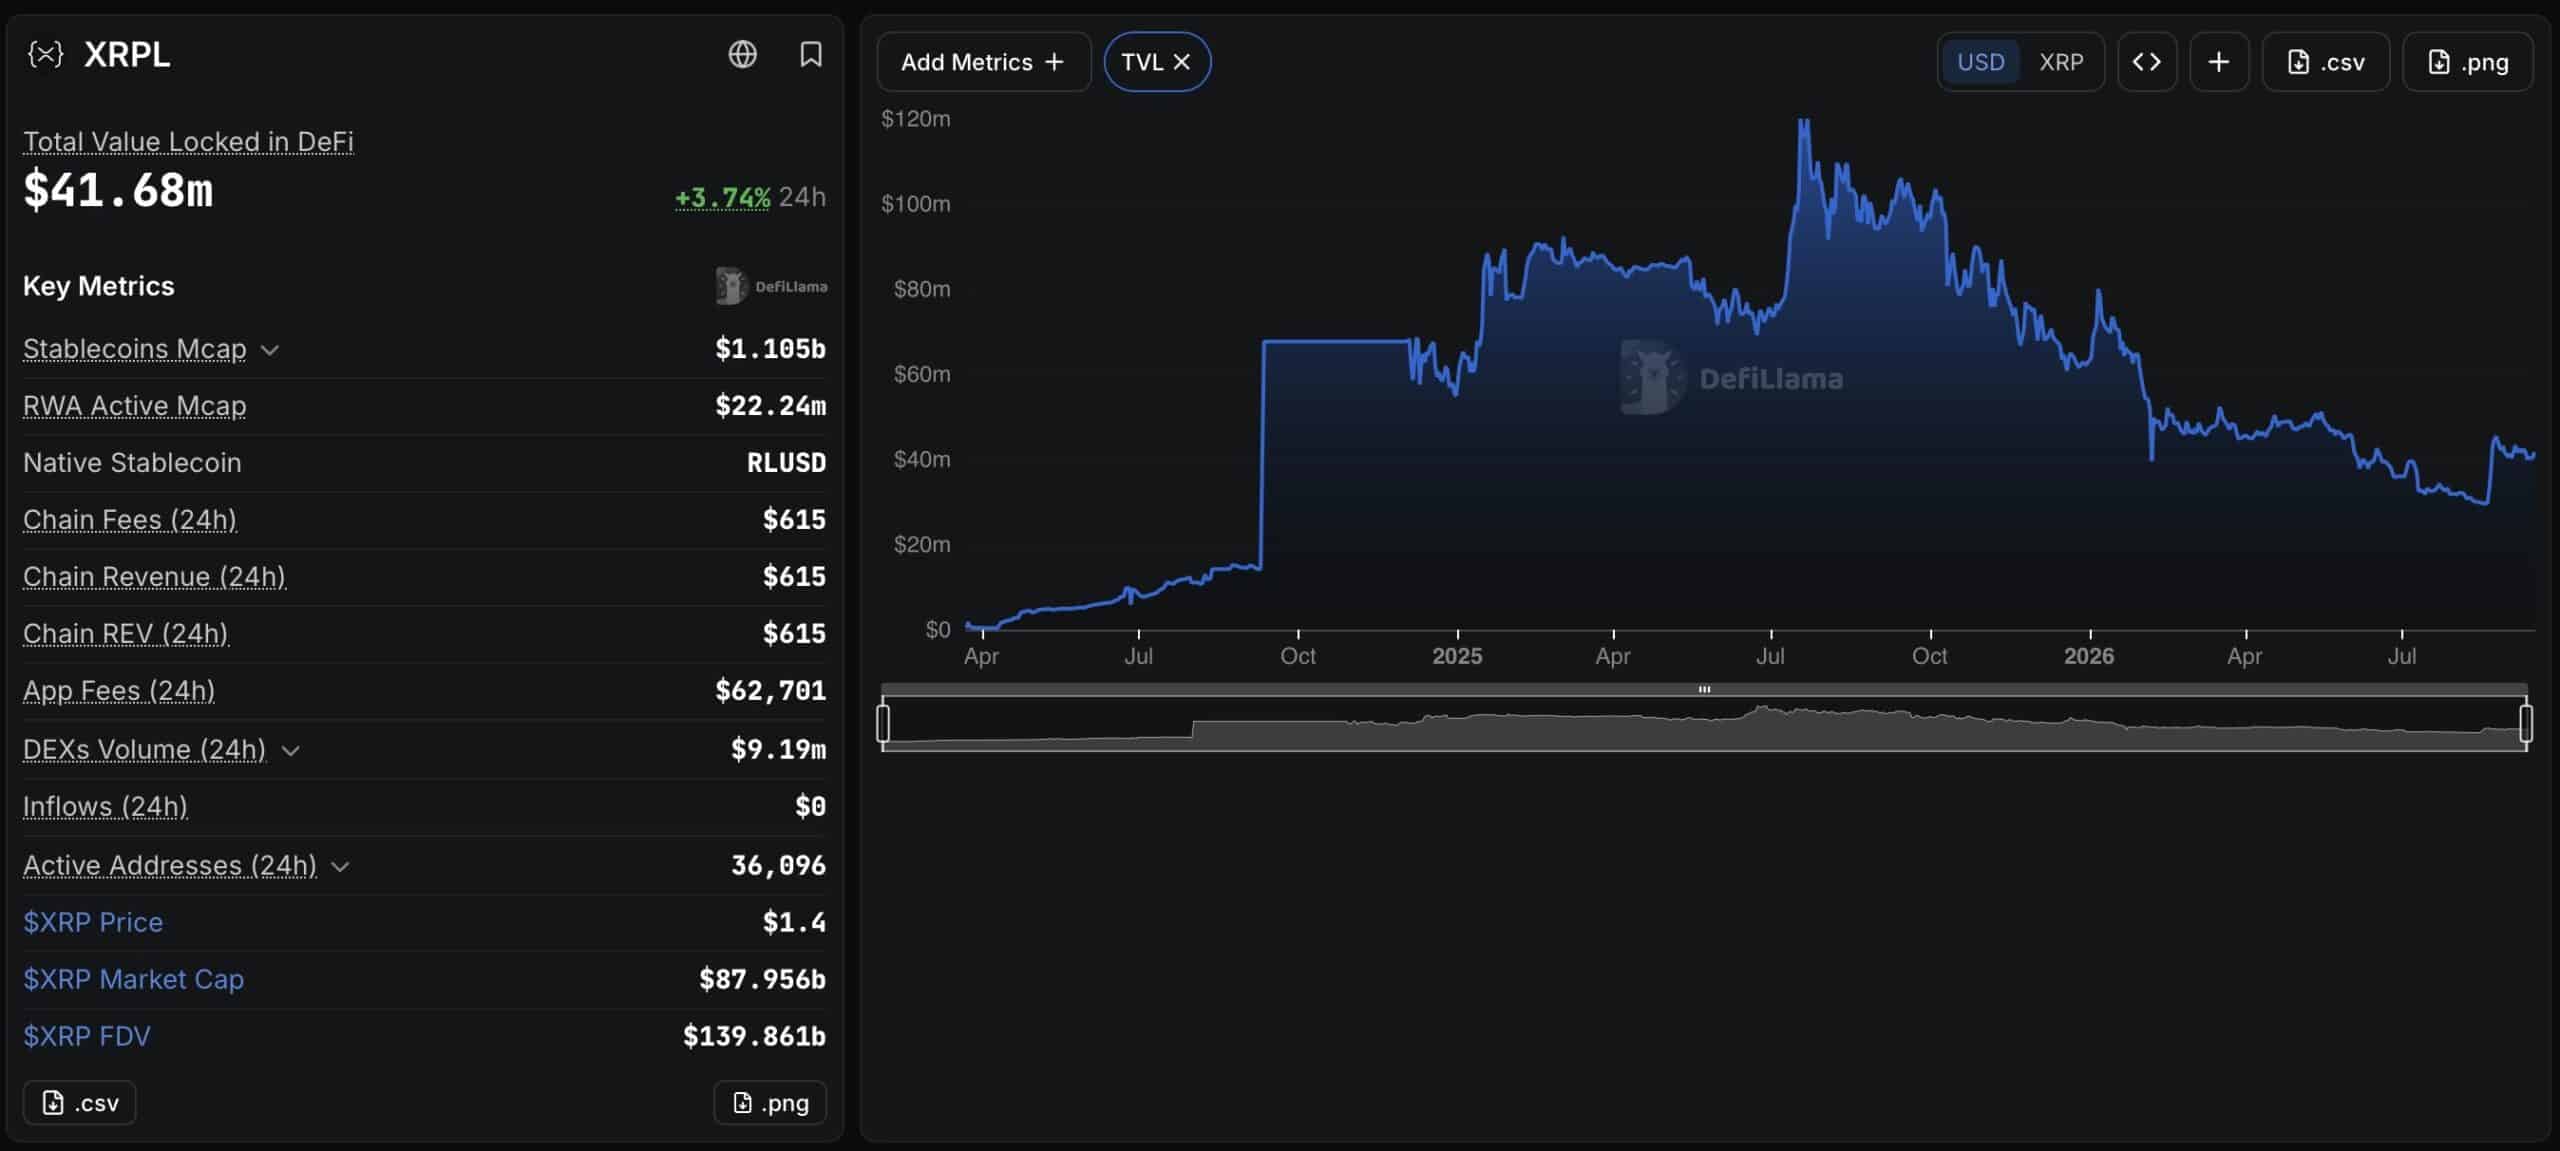
XRPL Overview DefilLama
Can XRP Price Hold $1.35 Support This Week?
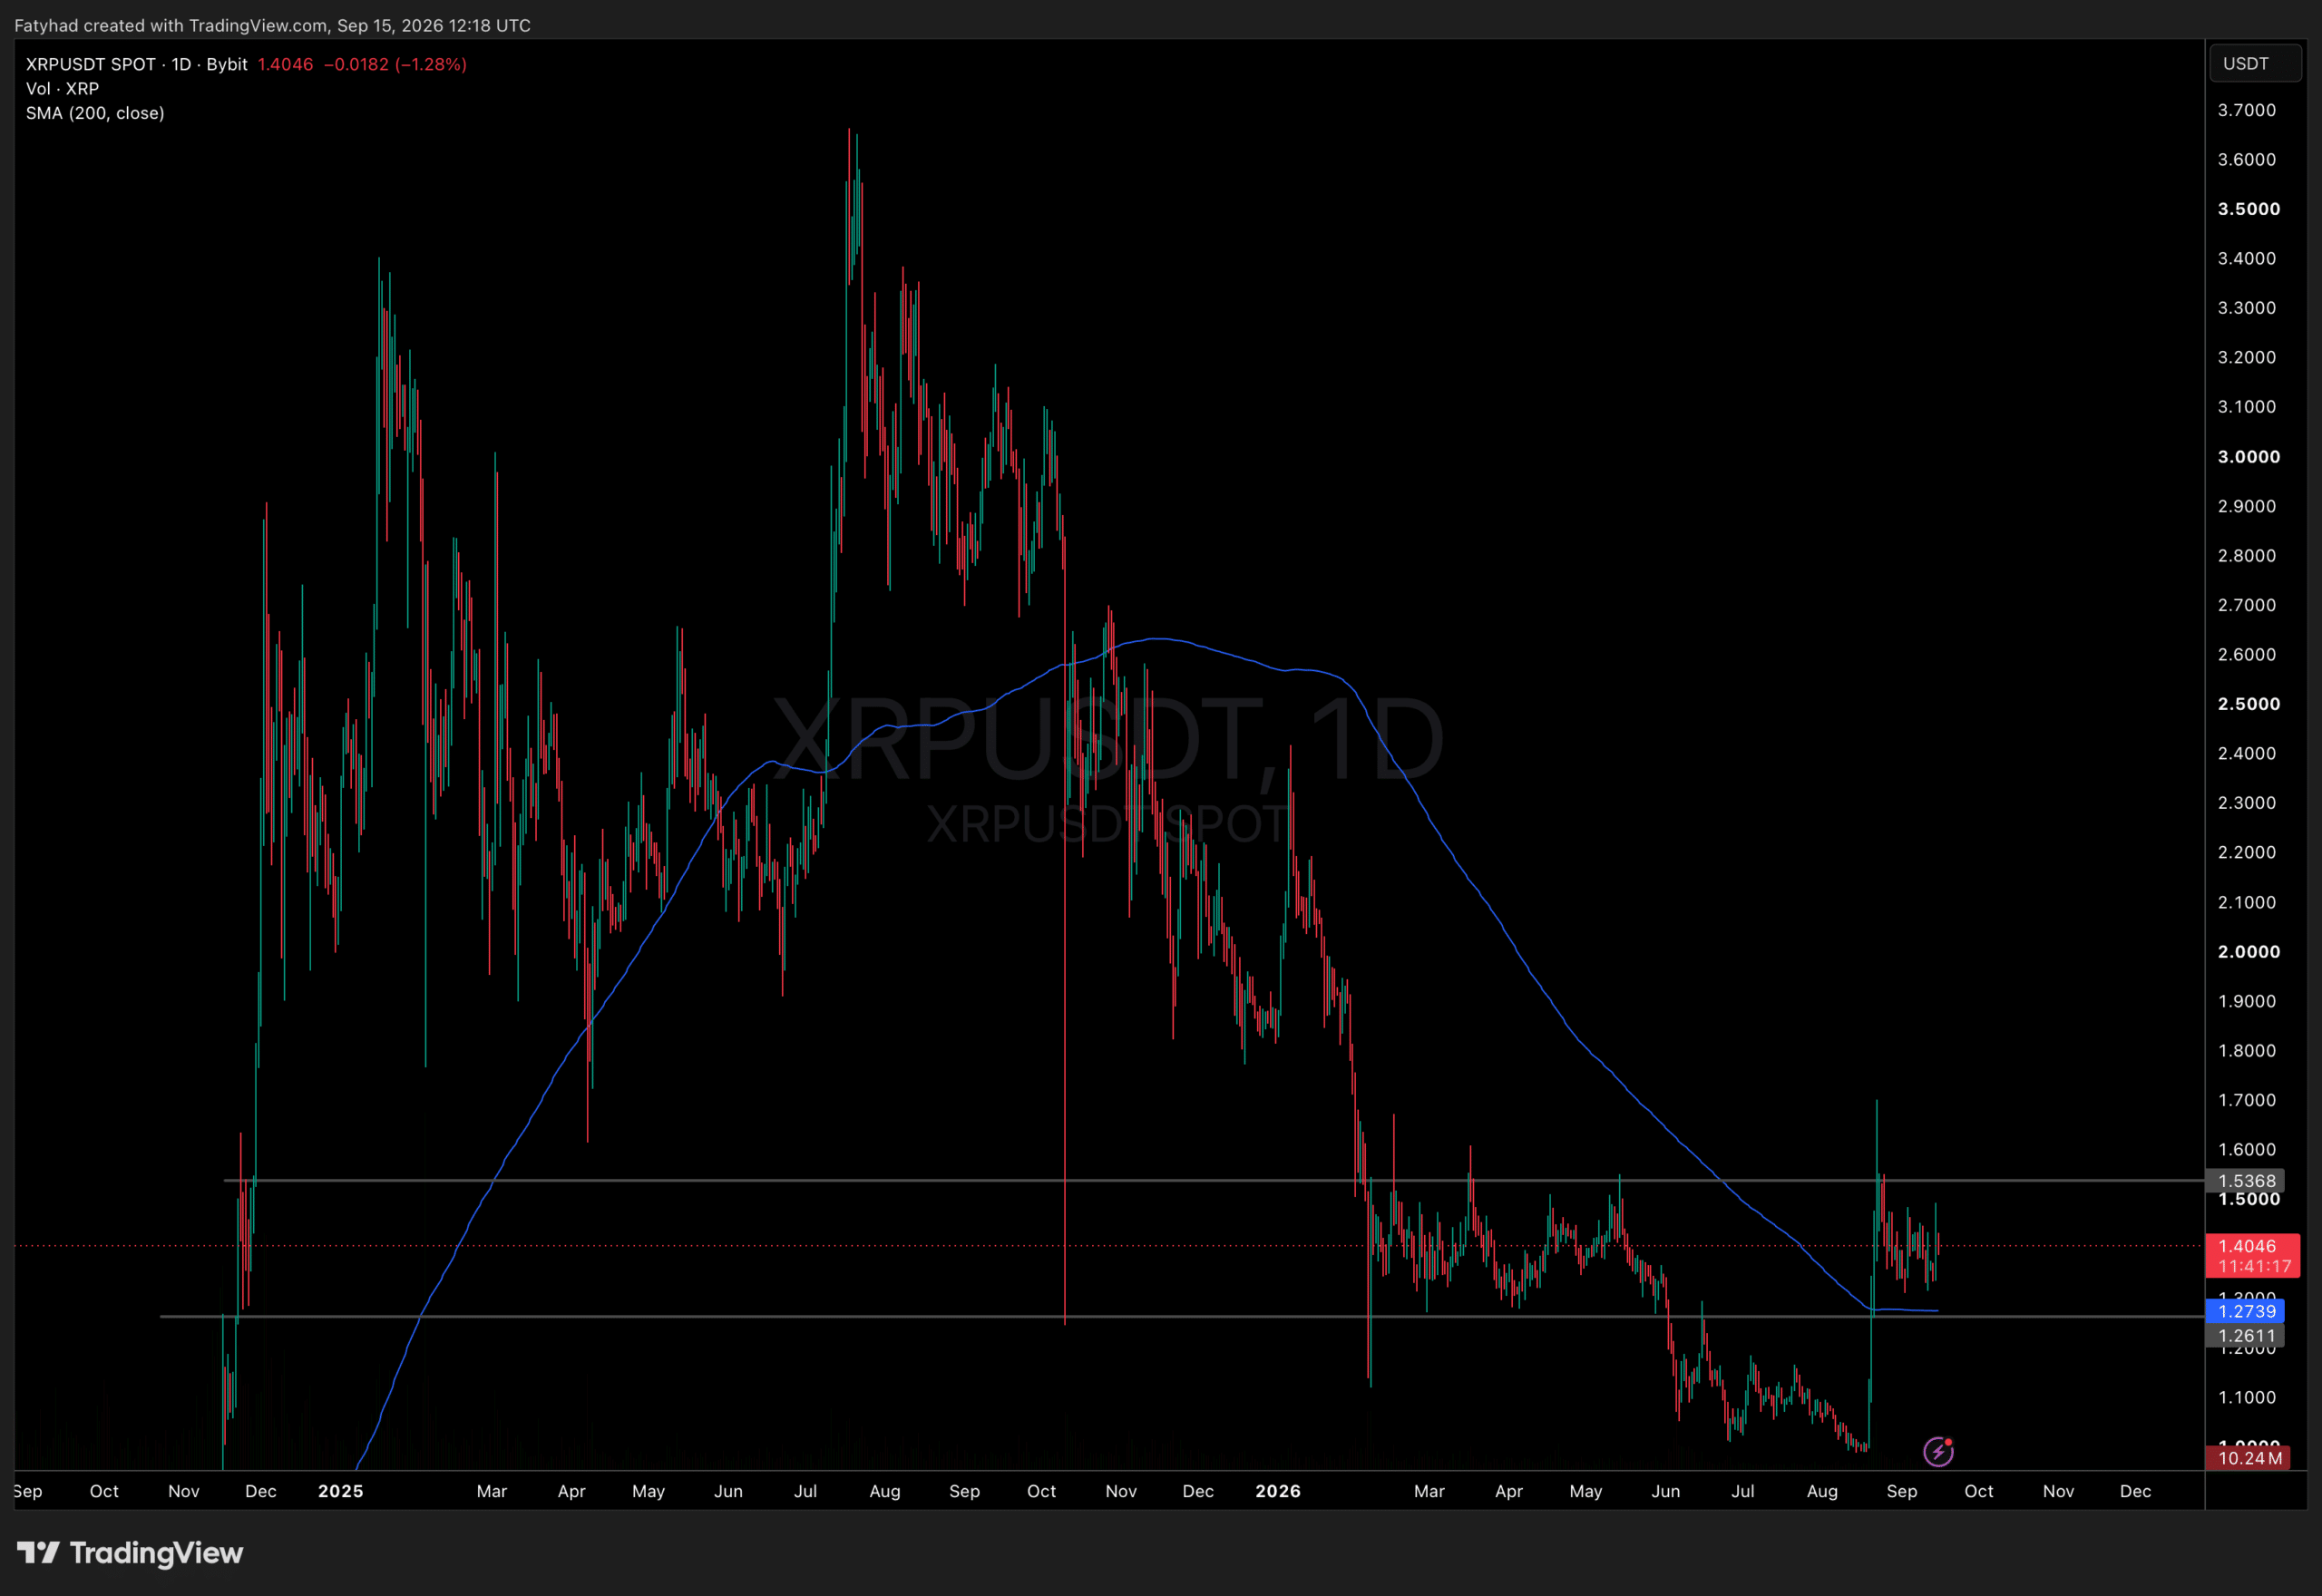
XRPUSDT Chart 1D TradingView
Based on this XRP price forecast, XRP is trading around $1.40, down just over 1% on the day, and the picture is one of a market trying to find its feet after a long decline. From last summer’s peak near $3.65, price bled steadily lower through 2026, bottoming close to $1.00 in August. A strong rebound followed, briefly touching $1.72 before settling into the current range.
The 200-day moving average, now flattening near $1.27, has turned from resistance into a floor worth watching. Above, the $1.54 level caps the recovery. A clean break there would strengthen the case for a genuine trend change rather than a relief bounce.
Support sits at $1.31–$1.35, with a deeper floor at $1.26 and $1.22 if that breaks. Resistance clusters at $1.43–$1.45, then $1.47–$1.50.
DISCOVER: Best Meme Coins to Buy in 2026


