

 thecryptobasic.com
$XRP Price at a Crossroads: Three Key Levels Could Define the Next Major Move.
$XRP is trading at an important technical junction on the 4-hour chart, where short-term weakness is developing inside a much larger recovery structure. Rather than reacting to every intraday candle, the chart highlights three broader areas that could determine how $XRP’s next substantial move develops.
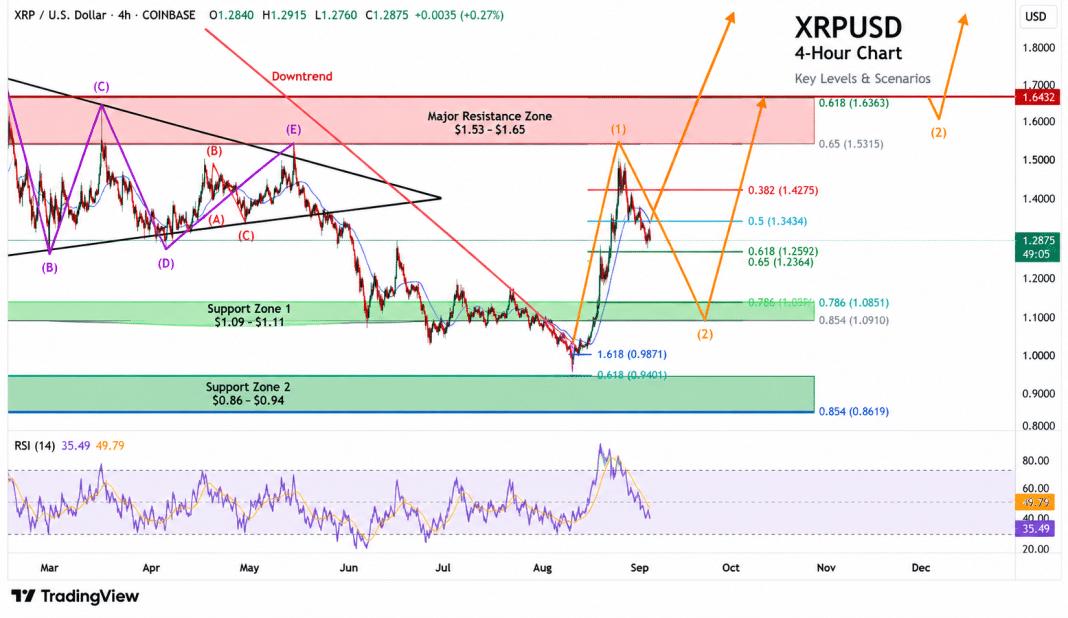
At the time captured on the chart, $XRP is near $1.2875 after failing to maintain its August surge toward the $1.50–$1.55 region. That rejection has pushed price back beneath several intermediate Fibonacci levels, shifting attention toward deeper support.
 $XRP USD 4H Technical chart
$XRP Approaches the First Major Support Zone
The first area to watch is the $1.09–$1.11 zone. This region carries considerable technical confluence. The chart places the macro 0.786 Fibonacci level around $1.085, while another retracement structure identifies approximately $1.091. A horizontal demand zone is also positioned in the same area.
Before $XRP reaches that support, however, price must work through the $1.26–$1.24 region, corresponding roughly with the 0.618 and 0.65 retracement levels. The latest candles show selling pressure pushing $XRP toward this area, making it the immediate technical battleground.
What Happens if $XRP Loses $1.10?
If $1.10 fails to attract sustained demand, the chart identifies a substantially deeper support zone around $0.86–$0.94.
The macro 0.854 retracement sits near $0.862, while $0.94 also corresponds with the previous major August bottoming structure. A move into this region would represent a much deeper retracement of the recent advance and could force the developing impulsive structure to restart from a new low.
This makes the lower green zone particularly significant. It is not simply another minor intraday support; it represents the next major structural area displayed on the chart beneath $1.10.
$XRP Bulls Have Another Scenario at $1.63–$1.65
There is also a bullish alternative that would prevent the lower targets from becoming the primary focus.
$XRP would first need to recover $1.34, followed by approximately $1.43 and $1.53. The most important overhead region is then $1.63–$1.65, where the chart shows the macro 0.618 resistance and a broad historical supply zone.
A sustained breakout through that ceiling, followed by expansion toward approximately $1.78, would materially change the current structure. In that scenario, a later pullback toward $1.63–$1.65 could become a test of former resistance as support.
That distinction matters: $XRP merely touching the resistance zone would not produce the same technical structure as breaking above it and subsequently holding it during a retest.
RSI Shows Short-Term $XRP Momentum Under Pressure
Momentum currently remains mixed. The RSI panel shows the faster reading near 35.49, while its accompanying average is around 49.79.
The gap between these readings reflects deteriorating short-term momentum. At the same time, RSI has not yet reached the more extreme readings visible during some of the earlier selloffs displayed on the chart.
That leaves room for price to continue testing lower support before momentum conditions necessarily resemble the previous major exhaustion points.
Latest Five Candles Show Sellers Still Active
The latest five candles reinforce the near-term pressure.
Price has struggled to produce sustained upside bodies following the recent rebound, while the upper wicks around recovery attempts indicate that supply continues to appear when $XRP pushes higher. The sharper decline into the latest group of candles further shows that buyers have not yet regained control of the 4-hour structure.
For that to change, $XRP would need to begin reclaiming the intermediate Fibonacci levels rather than repeatedly rejecting beneath them.
Wyckoff Structure Points to a Critical Retest
From a Wyckoff perspective, the August rally from roughly $0.94, followed by the rapid expansion toward $1.50, resembles an emergence from a prior accumulation area. The subsequent retracement is now testing whether that advance can develop into a more durable markup structure.
Holding around $1.09 would preserve a stronger higher-low structure relative to the August bottom. Losing that area would shift attention toward the deeper $0.94–$0.86 demand zone, where the broader structure would face a more substantial test.
Three $XRP Levels Now Matter Most
The chart ultimately reduces $XRP’s complicated short-term movement to three major reference areas: approximately $1.09–$1.11 as the first macro support, $0.86–$0.94 as deeper structural support, and $1.63–$1.65 as the major resistance zone that would eventually need to transition into support for the bullish structure to strengthen.
At roughly $1.29, $XRP remains between those larger technical decision points. The $1.24–$1.26 area is the immediate test, but the larger chart structure is likely to become much clearer when $XRP interacts with one of its major macro zones.
Until then, much of the movement between these levels remains consolidation and positioning inside the broader structure.


