Samsara (IOT) Jumps 5.3% During Day Trading: What’s Driving the Uptrend?

Samsara Surges on Sector Momentum
- Samsara (IOT) climbed 5.29% to $27.45, approaching its 52-week peak of $48.66.
- Microsoft (MSFT), a key player in the sector, advanced 2.5% as demand for AI and cloud services remains robust.
- Options activity for the March 6 expiration is elevated, with notable interest in the 28.5 call and 26.5 put contracts.
Samsara’s sharp intraday rise bucks its prevailing downward trend, fueled by renewed optimism across the Software & Services industry. Microsoft’s leadership and the broader rally in AI and cloud-related stocks have contributed to IOT’s 5.3% gain, signaling a short-term bullish shift. However, technical signals point to the possibility of price consolidation ahead.
Sector-Wide Strength Lifts Samsara
The Software & Services sector is experiencing widespread gains, with Microsoft’s 2.5% uptick setting the tone. Recent developments, such as Google’s Gemini 3.1 Pro release and AWS’s AI enhancements, have bolstered sector sentiment. Although Samsara hasn’t released company-specific news, its price movement mirrors the sector’s upward momentum, suggesting its rally is driven by broader industry trends rather than unique catalysts.
Microsoft’s Performance Highlights Positive Outlook
Samsara’s 5.3% increase outpaces Microsoft’s 2.5% gain, underscoring its relative strength within the sector. The rally is underpinned by strong demand for AI and cloud solutions, with Microsoft’s Copilot updates and Google’s advancements fueling investor enthusiasm. Samsara’s focus on IoT positions it to benefit from ongoing digital transformation, though its negative P/E ratio of -381 indicates ongoing structural challenges compared to its peers.
Options Activity and Technical Analysis
- MACD: -1.71 (Signal: -1.95, Histogram: 0.23) – Bearish crossover, but negative momentum is decreasing.
- RSI: 55.76 – Neutral, with potential for a directional move.
- Bollinger Bands: Upper: $30.33, Middle: $26.90, Lower: $23.47 – Price is near the upper band, suggesting overbought conditions.
- 200-Day Moving Average: $37.51 – The stock remains in a long-term downtrend.
Highlighted Options Contracts
-
IOT20260306C28.5 (Call, $28.50 strike, expires March 6)
- Implied Volatility: 112.52% (high)
- Leverage Ratio: 17.15% (moderate)
- Delta: 0.458 (moderate sensitivity)
- Theta: -0.1457 (significant time decay)
- Gamma: 0.0776 (high price sensitivity)
- Turnover: 4,309 (liquid)
- Potential Payoff at 5% Upside: $0.925
- Rationale: Elevated volatility and gamma make this contract attractive for traders expecting a short-term rally, with ample liquidity for trade management.
-
IOT20260306P26.5 (Put, $26.50 strike, expires March 6)
- Implied Volatility: 129.61% (high)
- Leverage Ratio: 14.83% (moderate)
- Delta: -0.3917 (moderate bearish exposure)
- Theta: -0.0622 (moderate time decay)
- Gamma: 0.0653 (high price sensitivity)
- Turnover: 2,590 (liquid)
- Potential Payoff at 5% Upside: $0.00
- Rationale: High volatility and delta offer downside protection if the rally loses steam, with sufficient liquidity for adjustments.
Trading Considerations
Traders with a bullish outlook may target the IOT20260306C28.5 call if the price breaks above $28.50, while those seeking to hedge risk can consider the IOT20260306P26.5 put. Key technical levels include $28.50 (call strike) and $26.50 (put strike). With RSI at 55.76, a breakout is possible, but the 200-day moving average at $37.51 remains a resistance point.
Samsara Backtest Results
A historical analysis of IOT’s performance following single-day gains of 5% or more (from 2022 to present) reveals a strategy return of 8.80%, compared to a 47.33% return for the SPY benchmark, resulting in an excess return of -38.53%. The strategy’s compound annual growth rate (CAGR) stands at 2.08%, with a maximum drawdown of 64.52%, highlighting considerable volatility and risk.
Backtest Summary
- Backtest Target: IOT
- Entry Condition: Intraday gain exceeds 5%
- Period: January 1, 2022 – February 25, 2026
- Strategy Return: +8.80%
- SPY Return: +47.33%
- Excess Return: -38.53%
- CAGR: +2.08%
- Max Drawdown: 64.52%
Outlook and Action Plan
While Samsara’s recent rally signals short-term momentum, its long-term trend remains negative, and its valuation challenges persist. Microsoft’s performance serves as a key indicator for the sector. A sustained move above $28.50 could confirm the rally, making the IOT20260306C28.5 call an appealing choice for aggressive traders, while the IOT20260306P26.5 put offers a hedge. Consider entering the call if the price holds above $28.50, and exit if the RSI falls below 50.
Disclaimer: The content of this article solely reflects the author's opinion and does not represent the platform in any capacity. This article is not intended to serve as a reference for making investment decisions.
You may also like
Buried Libra, Meta returns with a more cautious stablecoin strategy

ETHZilla stock climbs on Forum rebrand as firm pushes further into tokenized assets
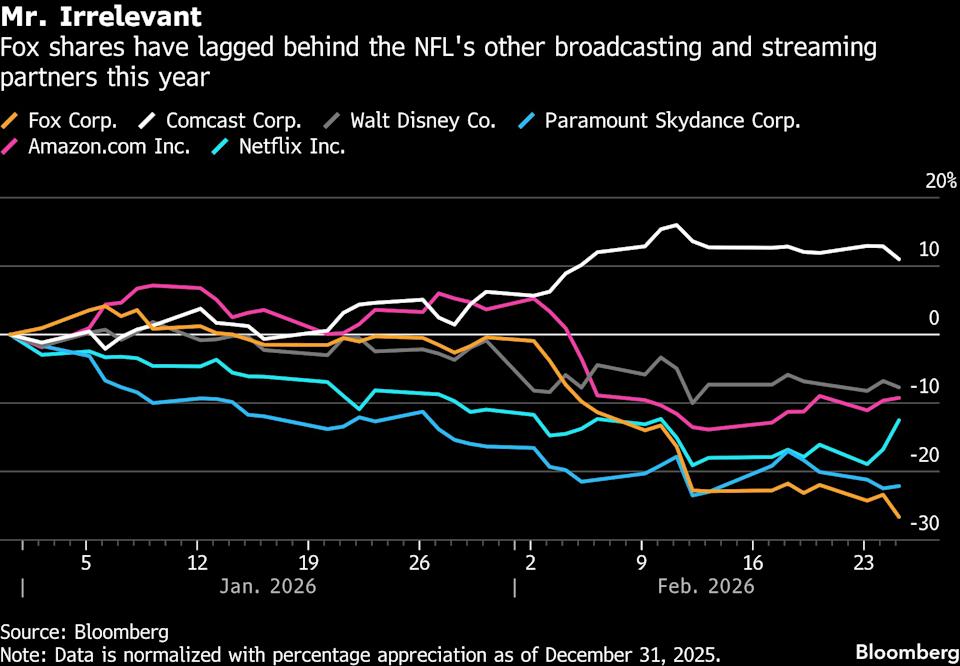
NFL contract concerns lead BofA to slash Fox shares with two-level downgrade
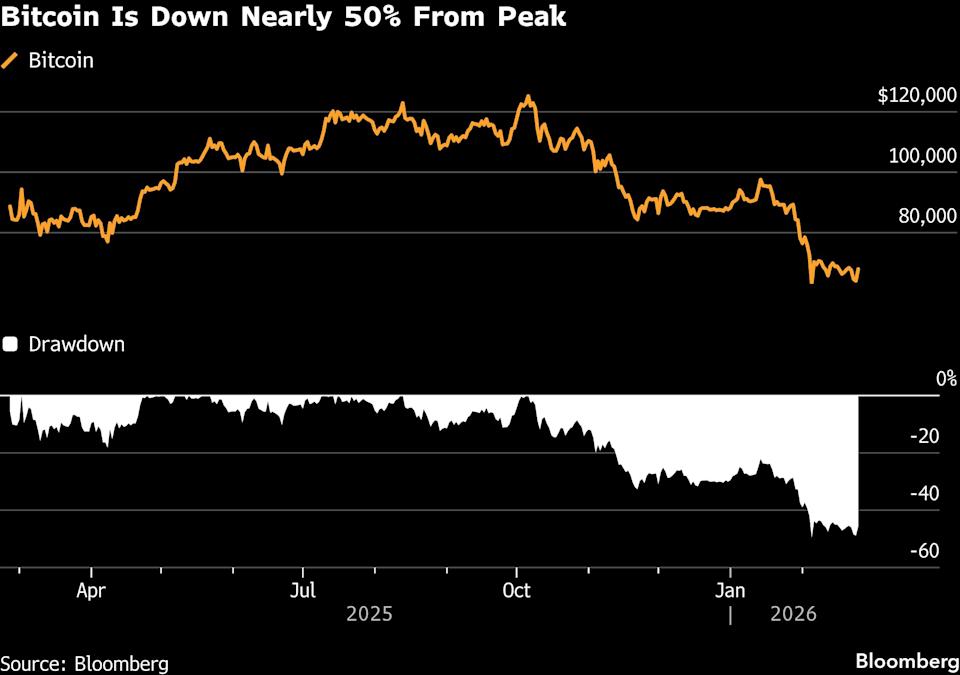
The Argument for Bitcoin's Strength Lies Within the Aftermath of the $1 Trillion Collapse